This exercise started as something else but I’ve been playing around with different ideas around the contentious Toronto municipal election and I ended up trying to work with shapefiles in R. I went down a couple of different avenues that ended up being too complex for my current skills. But I found a very useful YouTube video on how to work with shapefiles in R using geom_sf from the dev version of the ggplot2 package. A tip of the hat to Kevin Patrick O’Brien (Dragonfly Statistics) for the tutorial. Working with the Simple Features version of the shapefiles was much easier than the previous attempts I had made.
When loading the required packages, you will need the dev version of ggplot2 so that you can use the geom_sf command to render the simple features geometries as part of your plotted maps. I don’t know if this is most efficient way of doing it, however. (I doubt it!)
library(tidyverse) # Load all tidyverse packages
library(sf) # Simple Features for R
library(stringr)
library(colorspace) # For colour palettes

detach("package:ggplot2")

devtools::install_github("tidyverse/ggplot2")
library(ggplot2)

# my fonts
quartzFonts(ANXTC = c("Avenir Next Condensed Regular", "Avenir Next Condensed Demi Bold", "Avenir Next Condensed Italic", "Avenir Next Condensed Demi Bold Italic"))
First we want to collect shapefiles for the Toronto municipal wards. Since they are now the same as the Ontario provincial election ridings, we can get the shapefiles from the Elections Ontario website.
Let’s read the simple features version of the shapefiles collected. We get a simpler dataframe rather than a Large SpatialPolygonsDataFrame from my earlier attempts, which had all kinds of nested data that was more difficult to work with.
ont_shapes <- sf::read_sf("/Users/grspur/Documents/R/Data projects/ggParl experiment/Electoral District Shapefile - 2018 General Election/ELECTORAL_DISTRICT.shp")

head(ont_shapes)
## Simple feature collection with 6 features and 5 fields
## geometry type: POLYGON
## dimension: XY
## bbox: xmin: 1122494 ymin: 5366145 xmax: 1404633 ymax: 5522010
## epsg (SRID): NA
## proj4string: +proj=lcc +lat_1=44.5 +lat_2=54.5 +lat_0=0 +lon_0=-84 +x_0=1000000 +y_0=0 +datum=NAD83 +units=m +no_defs
## # A tibble: 6 x 6
## ED_ID ENGLISH_NA FRENCH_NAM SHAPE_area SHAPE_len
## <dbl> <chr> <chr> <dbl> <dbl>
## 1 8. Brampton Centre Brampton-Centre 4.44e7 32762.
## 2 97. "Scarborough\u0097Rou… "Scarborough\u0097Rou… 5.50e7 36379.
## 3 96. Scarborough North Scarborough-Nord 3.05e7 24007.
## 4 1. Ajax Ajax 6.80e7 37083.
## 5 91. "Sarnia\u0097Lambton" "Sarnia\u0097Lambton" 1.76e9 186023.
## 6 7. "Beaches\u0097East Yo… "Beaches\u0097East Yo… 1.87e7 20714.
## # ... with 1 more variable: geometry <POLYGON [m]>The geometry column of this new dataframe is the powerful data that contains all the shape-plotting information. It’s also a simple dataframe, which will make it easier to filter later.
Let’s see if these geometries will plot. (It may take a bit of time to render.)
ggplot(ont_shapes) + geom_sf()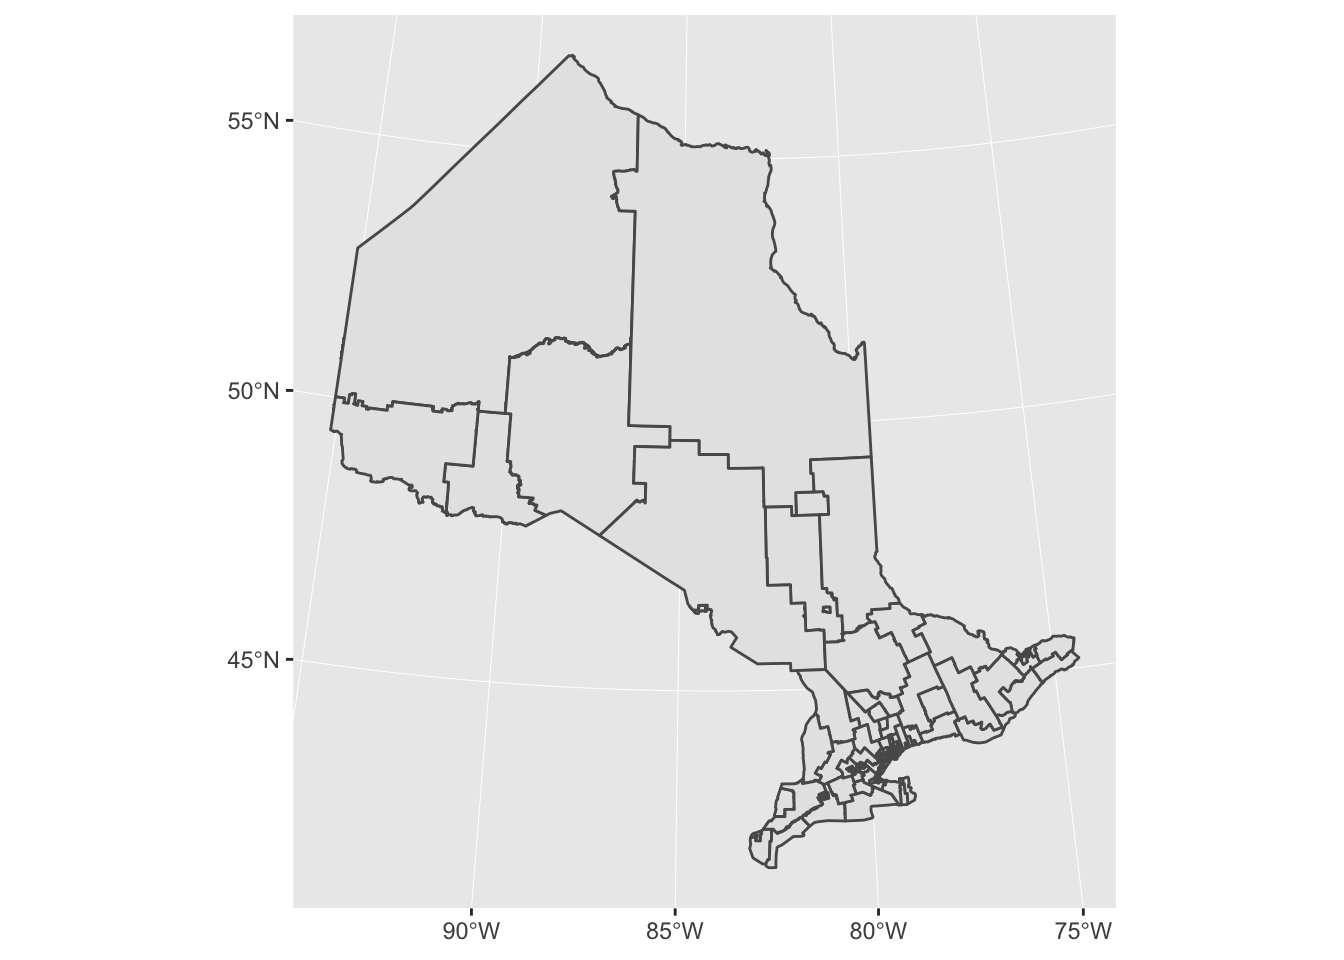
OK, that looks like the correct general shape. But since I’m only interested in the Toronto ridings that match the municipal wards, we need to find the index numbers for the Toronto ridings. For lack of a better solution, I simply did this the long way by looking at all the riding names in the “ENGLISH_NA” column of our ont_shapes dataframe.
# what are the row index numbers for the 25 Toronto wards/ridings? Doing this manually
ont_ridings <- ont_shapes$ENGLISH_NA
ont_ridings
## [1] "Brampton Centre"
## [2] "Scarborough\u0097Rouge Park"
## [3] "Scarborough North"
## [4] "Ajax"
## [5] "Sarnia\u0097Lambton"
## [6] "Beaches\u0097East York"
## [7] "Mississauga\u0097Malton"
## [8] "Ottawa South"
## [9] "Haldimand\u0097Norfolk"
## [10] "Thunder Bay\u0097Atikokan"
## [11] "London North Centre"
## [12] "Scarborough\u0097Agincourt"
## [13] "Markham\u0097Unionville"
## [14] "London\u0097Fanshawe"
## [15] "Stormont\u0097Dundas\u0097South Glengarry"
## [16] "Brampton West"
## [17] "Waterloo"
## [18] "Don Valley North"
## [19] "Etobicoke Centre"
## [20] "Renfrew\u0097Nipissing\u0097Pembroke"
## [21] "Barrie\u0097Innisfil"
## [22] "Mississauga East\u0097Cooksville"
## [23] "St. Catharines"
## [24] "Carleton"
## [25] "Niagara West"
## [26] "Hamilton West\u0097Ancaster\u0097Dundas"
## [27] "Aurora\u0097Oak Ridges\u0097Richmond Hill"
## [28] "Mississauga Centre"
## [29] "Mississauga\u0097Lakeshore"
## [30] "Kanata\u0097Carleton"
## [31] "York Centre"
## [32] "Northumberland\u0097Peterborough South"
## [33] "Newmarket\u0097Aurora"
## [34] "Kiiwetinoong"
## [35] "Durham"
## [36] "Kenora\u0097Rainy River"
## [37] "Sudbury"
## [38] "Nipissing"
## [39] "Barrie\u0097Springwater\u0097Oro-Medonte"
## [40] "Simcoe\u0097Grey"
## [41] "Haliburton\u0097Kawartha Lakes\u0097Brock"
## [42] "Peterborough\u0097Kawartha"
## [43] "Bay of Quinte"
## [44] "Leeds\u0097Grenville\u0097Thousand Islands and Rideau Lakes"
## [45] "Timmins"
## [46] "Thunder Bay\u0097Superior North"
## [47] "Kingston and the Islands"
## [48] "Oshawa"
## [49] "Whitby"
## [50] "Windsor\u0097Tecumseh"
## [51] "Windsor West"
## [52] "Essex"
## [53] "Mushkegowuk\u0097James Bay"
## [54] "Markham\u0097Thornhill"
## [55] "Oakville"
## [56] "Mississauga\u0097Erin Mills"
## [57] "Willowdale"
## [58] "Don Valley East"
## [59] "Scarborough\u0097Guildwood"
## [60] "Hastings\u0097Lennox and Addington"
## [61] "Lanark\u0097Frontenac\u0097Kingston"
## [62] "London West"
## [63] "Scarborough Southwest"
## [64] "Scarborough Centre"
## [65] "Dufferin\u0097Caledon"
## [66] "Don Valley West"
## [67] "Eglinton\u0097Lawrence"
## [68] "Kitchener South\u0097Hespeler"
## [69] "Kitchener Centre"
## [70] "Toronto\u0097St. Paul's"
## [71] "King\u0097Vaughan"
## [72] "Richmond Hill"
## [73] "Brampton East"
## [74] "Milton"
## [75] "Brampton North"
## [76] "Oakville North\u0097Burlington"
## [77] "Burlington"
## [78] "Wellington\u0097Halton Hills"
## [79] "Guelph"
## [80] "Chatham-Kent\u0097Leamington"
## [81] "Toronto\u0097Danforth"
## [82] "Etobicoke\u0097Lakeshore"
## [83] "Parkdale\u0097High Park"
## [84] "University\u0097Rosedale"
## [85] "Toronto Centre"
## [86] "Nepean"
## [87] "Glengarry\u0097Prescott\u0097Russell"
## [88] "Flamborough\u0097Glanbrook"
## [89] "Niagara Falls"
## [90] "Niagara Centre"
## [91] "Brantford\u0097Brant"
## [92] "Cambridge"
## [93] "Mississauga\u0097Streetsville"
## [94] "Brampton South"
## [95] "Markham\u0097Stouffville"
## [96] "Hamilton Mountain"
## [97] "Hamilton Centre"
## [98] "Hamilton East\u0097Stoney Creek"
## [99] "Nickel Belt"
## [100] "Sault Ste. Marie"
## [101] "Algoma\u0097Manitoulin"
## [102] "Timiskaming\u0097Cochrane"
## [103] "Ottawa\u0097Vanier"
## [104] "Ottawa West\u0097Nepean"
## [105] "Orléans"
## [106] "Ottawa Centre"
## [107] "Etobicoke North"
## [108] "York South\u0097Weston"
## [109] "Humber River\u0097Black Creek"
## [110] "Bruce\u0097Grey\u0097Owen Sound"
## [111] "Perth\u0097Wellington"
## [112] "Thornhill"
## [113] "Vaughan\u0097Woodbridge"
## [114] "Kitchener\u0097Conestoga"
## [115] "Parry Sound\u0097Muskoka"
## [116] "Spadina\u0097Fort York"
## [117] "Simcoe North"
## [118] "Davenport"
## [119] "Oxford"
## [120] "Pickering\u0097Uxbridge"
## [121] "York\u0097Simcoe"
## [122] "Huron\u0097Bruce"
## [123] "Elgin\u0097Middlesex\u0097London"
## [124] "Lambton\u0097Kent\u0097Middlesex"(In hindsight, I could have tried to inner_join ont_shapes with another dataframe I will load shortly with data pertaining only to the Toronto election and its 25 wards. But the names contained in “ENGLISH_NA” have all the hyphens represented with “097”, which needs some further cleaning.)
Anyway, since the 25 Toronto ridings are have been identified by their row indexes, we can slice the 124-row ont_shapes into a 25-row dataframe called tor_shapes.
tor_shapes <- slice(ont_shapes, c(2,3,6,12,18,19,31,57,58,59,63,64,66,67,70,81,82,83,84,85,107,108,109,116,118))

tor_shapes <- arrange(tor_shapes, ENGLISH_NA)

# later manual fixes for the riding names
tor_shapes[1,2] <- "Beaches-East York"
tor_shapes[6,2] <- "Eglinton-Lawrence"
tor_shapes[9,2] <- "Etobicoke-Lakeshore"
tor_shapes[10,2] <- "Humber River-Black Creek"
tor_shapes[11,2] <- "Parkdale-High Park"
tor_shapes[15:17,2] <- c("Scarborough-Agincourt", "Scarborough-Guildwood", "Scarborough-Rouge River")
tor_shapes[c(18,20:22,25),2] <- c("Spadina-Fort York", "Toronto-Danforth", "Toronto-St. Paul's", "University-Rosedale", "York South-Weston")

head(tor_shapes)
## Simple feature collection with 6 features and 5 fields
## geometry type: POLYGON
## dimension: XY
## bbox: xmin: 1365033 ymin: 5488613 xmax: 1381040 ymax: 5508438
## epsg (SRID): NA
## proj4string: +proj=lcc +lat_1=44.5 +lat_2=54.5 +lat_0=0 +lon_0=-84 +x_0=1000000 +y_0=0 +datum=NAD83 +units=m +no_defs
## # A tibble: 6 x 6
## ED_ID ENGLISH_NA FRENCH_NAM SHAPE_area SHAPE_len
## <dbl> <chr> <chr> <dbl> <dbl>
## 1 7. Beaches-East York "Beaches\u0097East York" 18736714. 20714.
## 2 19. Davenport Davenport 12109942. 17396.
## 3 20. Don Valley East Don Valley-Est 23024237. 22365.
## 4 21. Don Valley North Don Valley-Nord 24486527. 20167.
## 5 22. Don Valley West Don Valley-Ouest 30355267. 27205.
## 6 25. Eglinton-Lawrence "Eglinton\u0097Lawrence" 22725759. 20828.
## # ... with 1 more variable: geometry <POLYGON [m]>We can take a stab at plotting the tor_shapes file now. I will also take the steps to make a plain white background and to remove the latitudes and longitudes from the x and y axes.
ggplot(tor_shapes[1]) +
  geom_sf() +
  theme_minimal() +
  scale_x_continuous(breaks = FALSE) +
  scale_y_continuous(breaks = FALSE)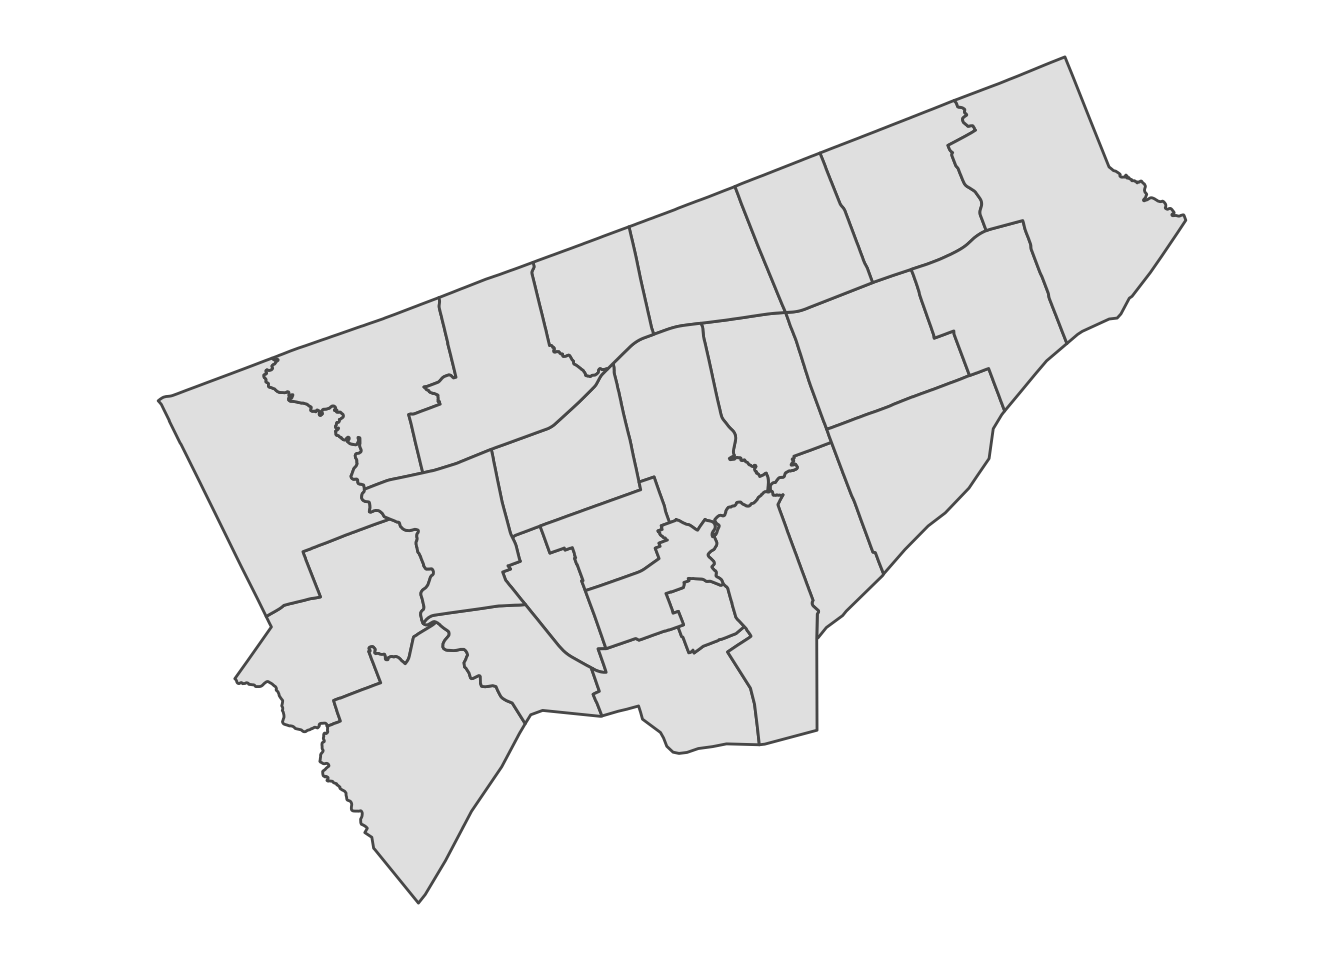
Excellent, that looks as it should, although a geography stickler might complain that we don’t have any definition for the Toronto Islands area.
I will now load the data I collected on the Toronto wards that I want to use as fill parameters on my ward map.
toco_new <- read_csv("/Users/grspur/Documents/R/Data projects/ggParl experiment/TorontoCouncil.csv")toco_new <- arrange(toco_new, Ward)
#print table with relevant columns for all 25 wards (for reference to the maps we'll make below)
toco_new[,c(1,2,4,5,6)]## # A tibble: 25 x 5
## Ward `Ward name` Candidates Incumbents Population
## <int> <chr> <int> <int> <dbl>
## 1 1 Etobicoke North 9 2 111343.
## 2 2 Etobicoke Centre 5 2 113606.
## 3 3 Etobicoke-Lakeshore 10 1 122999.
## 4 4 Parkdale-High Park 10 1 105103.
## 5 5 York South-Weston 11 2 116606.
## 6 6 York Centre 4 2 118358.
## 7 7 Humber River-Black Creek 8 2 108198.
## 8 8 Eglinton-Lawrence 10 1 113150.
## 9 9 Davenport 4 1 108475.
## 10 10 Spadina-Fort York 14 1 115506.
## # ... with 15 more rowsThis dataframe has the ward number, the number of candidates running for councillor in the ward, the number of incumbents from the 44-ward council running in the 25-ward election and the population of the new wards. I also named a column containing the ward names “ENGLISH_NA” to match tor_shapes
Now I will merge the two dataframe.
tor_shapes_data <- full_join(toco_new, tor_shapes, by = "ENGLISH_NA")I had to make a brief interlude to fix one riding (Scarborough-Rouge Park) that was not named differently in the two joined files.
Now we can try our first filled map using the “Incumbents” column. I was interested to know which wards had multiple incumbents running. (I made some incremental steps to get the ward numbers to show up and played around with the colour scheme but here’s the final version.)
## INCUMBENTS MAP
myTitle <- "Toronto election: Where 2 becomes 1"
mySubtitle <- "The number of incumbents from the 2014 election running in each of the 2018 imposed wards"
myXLabel <- NULL
myYLabel <- NULL
myCaption <- "Data source: Elections Ontario, Toronto.ca, Wikipedia  |  @grspur"

ggplot(tor_shapes_data) +
  geom_sf(aes(fill = as.factor(Incumbents)), colour = 'white') +
  geom_sf_text(label = tor_shapes_data$Ward, colour = 'white', fontface = 'bold') +
  scale_fill_manual(values = c("snow3", "steelblue3", "navyblue"), name = "Incumbents\nrunning") +
  theme_minimal() +
  scale_x_continuous(breaks = FALSE) +
  scale_y_continuous(breaks = FALSE) +
  theme(text = element_text(family = "ANXTC"),
        plot.title = element_text(size = 16, face = "bold"),
        plot.subtitle = element_text(size = 13, face = "plain"),
        plot.caption = element_text(size = 12, face = "plain"),
        legend.background = (element_rect(colour = "white")),
        legend.position = c(.85, .3), legend.justification = "left",
        legend.title = element_text(size = 12, face = "bold"),
        legend.text = element_text(size = 11, face = "plain")) +
  labs(title = myTitle, subtitle = mySubtitle, x = myXLabel, y = myYLabel, caption = myCaption)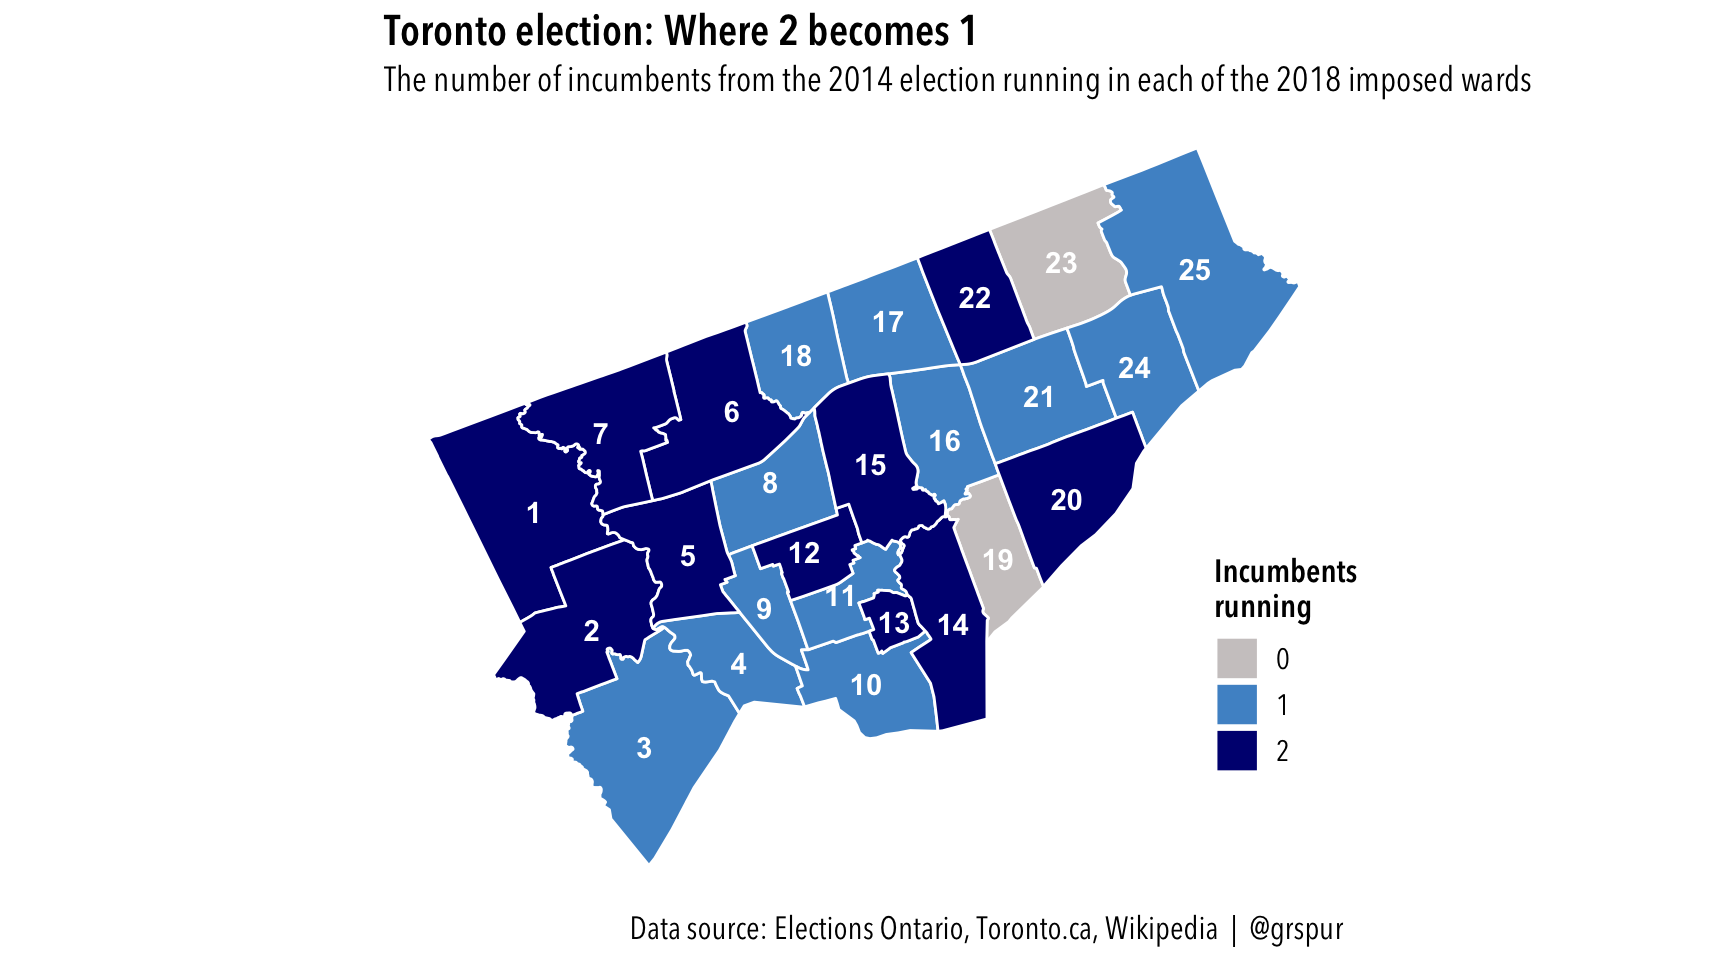
Of note in the above map, Shelley Carroll was elected as a councillor in 2014 but resigned to run in the 2018 provincial election. She is running again for council in Ward 17 but is not being counted as an incument here.
And here’s the map for the “Population” column.
## POPULATION MAP
myTitle <- "Toronto election: Pop goes the people"
mySubtitle <- "The population size of the 2018 imposed wards"
myXLabel <- NULL
myYLabel <- NULL
myCaption <- "Data source: Elections Ontario, Toronto.ca, Wikipedia  |  @grspur"

ggplot(tor_shapes_data) +
  geom_sf(aes(fill = Population), colour = 'white') +
  geom_sf_text(label = tor_shapes_data$Ward, colour = 'black', fontface = 'bold') +
  scale_fill_gradient(low = "lightgoldenrod1", high = "seagreen4") +
  theme_minimal() +
  scale_x_continuous(breaks = FALSE) +
  scale_y_continuous(breaks = FALSE) +
  theme(text = element_text(family = "ANXTC"),
        plot.title = element_text(size = 16, face = "bold"),
        plot.subtitle = element_text(size = 13, face = "plain"),
        plot.caption = element_text(size = 12, face = "plain"),
        legend.background = (element_rect(colour = "white")),
        legend.position = c(.85, .3), legend.justification = "left",
        legend.title = element_text(size = 12, face = "bold"),
        legend.text = element_text(size = 11, face = "plain")) +
  labs(title = myTitle, subtitle = mySubtitle, x = myXLabel, y = myYLabel, caption = myCaption)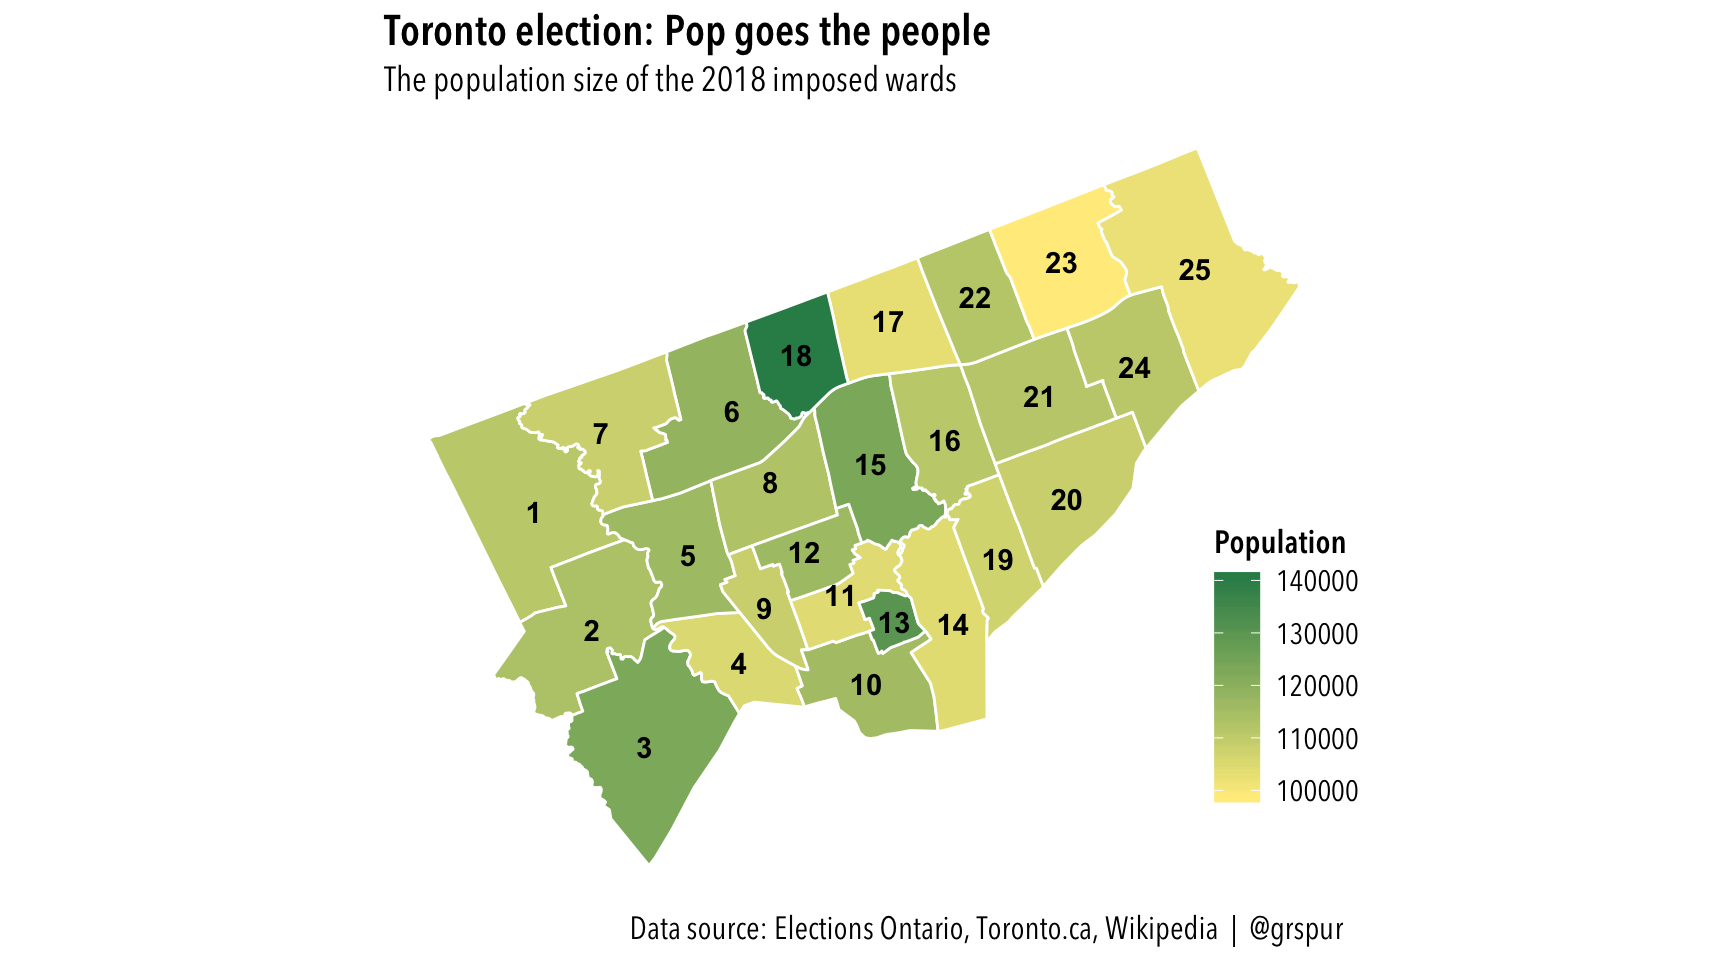
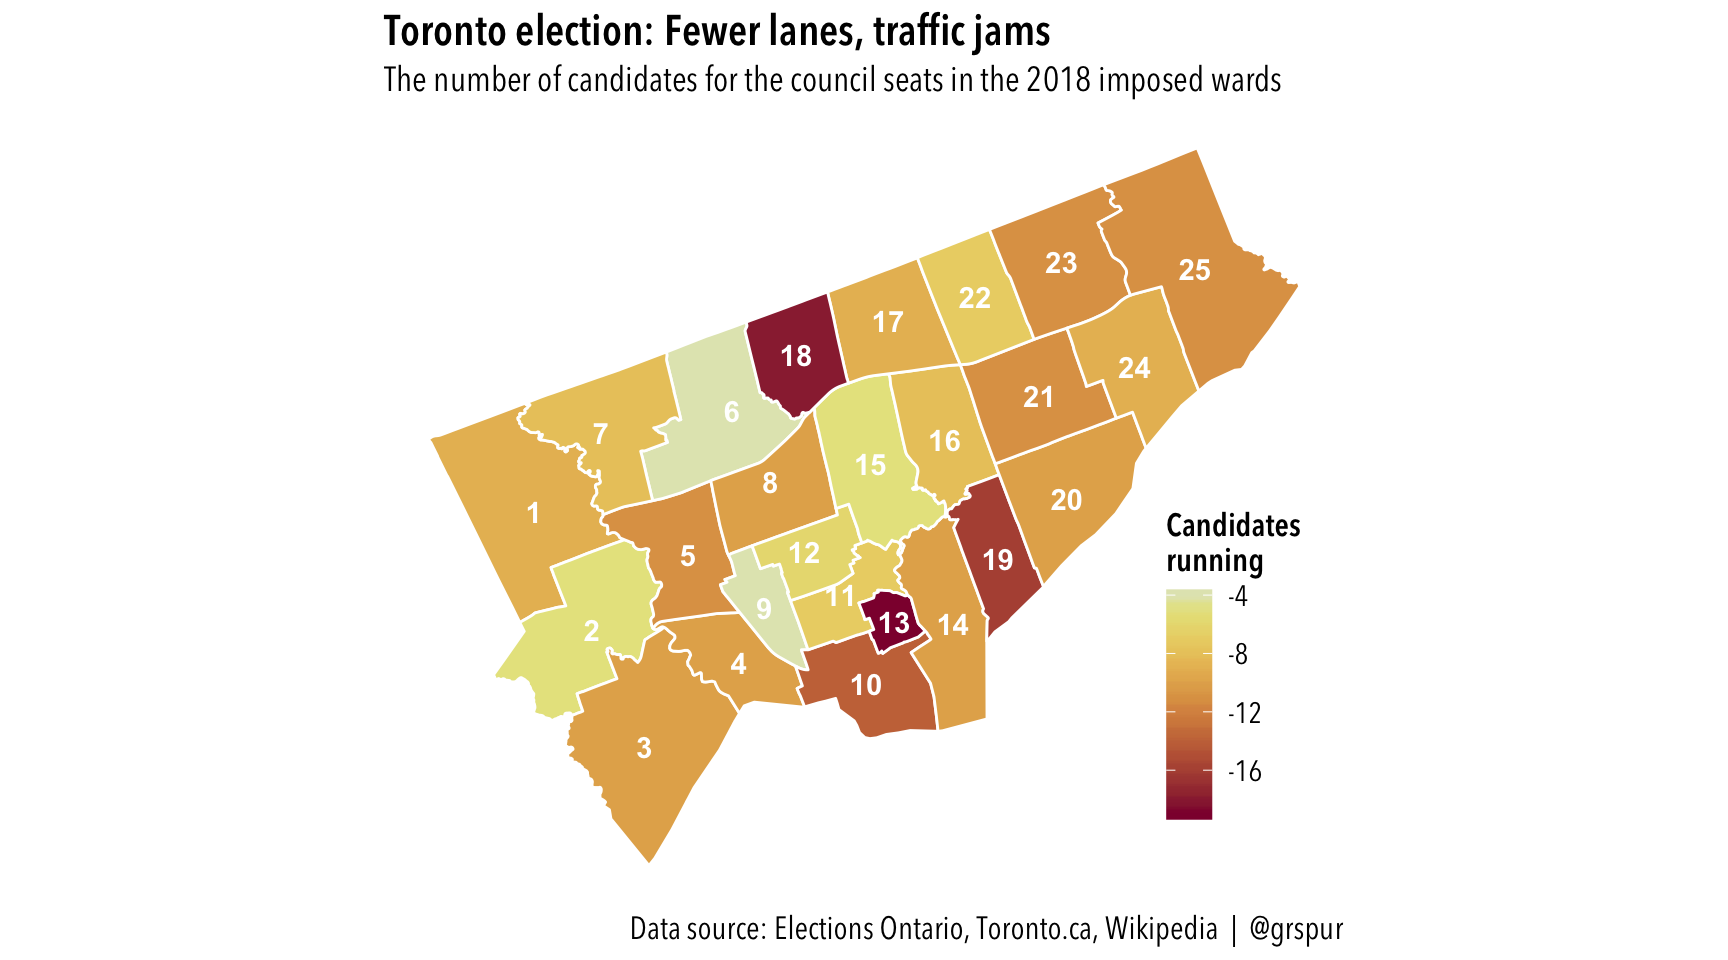
And a final one for the number of council candidates in each ward.
## CANDIDATES MAP
myTitle <- "Toronto election: Fewer lanes, traffic jams"
mySubtitle <- "The number of candidates for the council seats in the 2018 imposed wards"
myXLabel <- NULL
myYLabel <- NULL
myCaption <- "Data source: Elections Ontario, Toronto.ca, Wikipedia  |  @grspur"

myCols <- colorspace::heat_hcl(16, c = c(80, 30), l = c(30, 90), power = c(1/5, 1.5))

ggplot(tor_shapes_data) +
  geom_sf(aes(fill = -Candidates), colour = 'white') +
  geom_sf_text(label = tor_shapes_data$Ward, colour = 'white', fontface = 'bold') +
  scale_fill_gradientn(colours = myCols, name = "Candidates\nrunning") +
  theme_minimal() +
  scale_x_continuous(breaks = FALSE) +
  scale_y_continuous(breaks = FALSE) +
  theme(text = element_text(family = "ANXTC"),
        plot.title = element_text(size = 16, face = "bold"),
        plot.subtitle = element_text(size = 13, face = "plain"),
        plot.caption = element_text(size = 12, face = "plain"),
        legend.background = (element_rect(colour = "white")),
        legend.position = c(.8, .3), legend.justification = "left",
        legend.title = element_text(size = 12, face = "bold"),
        legend.text = element_text(size = 11, face = "plain")) +
  labs(title = myTitle, subtitle = mySubtitle, x = myXLabel, y = myYLabel, caption = myCaption)