
A couple of weeks ago, a Twitter user posted a photo of a restaurant menu page with an alarming array of choices. Not choices of sauces, though — choices of order sizes.
theres gotta be a better way to convey this information pic.twitter.com/pHEswDU0TC
— sean (@seanposting) October 21, 2018
The tweet caught fire, as crazy|weird things do on Twitter, and it received more than 5,000 retweets and 20,000 likes. @seanposting added this kicker, which increased the furore:
id like to point out this is a chinese restaurant
— sean (@seanposting) October 21, 2018
A Buzzfeed story identified the restaurant as Danny’s Wok, which has two locations in Philadelphia. (Mmmm, shrimp fried rice party tray.)
This tweet came into my timeline because it caught the attention of data-science Twitter, which was interested in the menu first as a exploratory data analysis exercise and then as a problem to be solved (which we will come back to).
So let’s load the menu data into R and see what the data tells us. I ran the photo of the menu through a free online OCR site (because who wants to type that out), cleaned up the output and double-checked the results.
| Count | Price | per.Unit |
|---|---|---|
| 4 | 4.55 | 1.137500 |
| 5 | 5.70 | 1.140000 |
| 6 | 6.80 | 1.133333 |
| 7 | 7.95 | 1.135714 |
| 8 | 9.10 | 1.137500 |
| 9 | 10.20 | 1.133333 |
| 10 | 11.35 | 1.135000 |
| 11 | 12.50 | 1.136364 |
| 12 | 13.60 | 1.133333 |
| 13 | 14.75 | 1.134615 |
| 14 | 15.90 | 1.135714 |
| 15 | 17.00 | 1.133333 |
| 16 | 18.15 | 1.134375 |
| 17 | 19.30 | 1.135294 |
| 18 | 20.40 | 1.133333 |
| 19 | 21.55 | 1.134211 |
| 20 | 22.70 | 1.135000 |
| 21 | 23.80 | 1.133333 |
| 22 | 24.95 | 1.134091 |
| 23 | 26.10 | 1.134783 |
| 24 | 27.25 | 1.135417 |
| 25 | 27.80 | 1.112000 |
| 26 | 28.95 | 1.113462 |
| 27 | 30.10 | 1.114815 |
| 28 | 31.20 | 1.114286 |
| 29 | 32.35 | 1.115517 |
| 30 | 33.50 | 1.116667 |
| 35 | 39.15 | 1.118571 |
| 40 | 44.80 | 1.120000 |
| 45 | 50.50 | 1.122222 |
| 50 | 55.60 | 1.112000 |
| 60 | 67.00 | 1.116667 |
| 70 | 78.30 | 1.118571 |
| 75 | 83.45 | 1.112667 |
| 80 | 89.10 | 1.113750 |
| 90 | 100.45 | 1.116111 |
| 100 | 111.25 | 1.112500 |
| 125 | 139.00 | 1.112000 |
| 150 | 166.85 | 1.112333 |
| 200 | 222.50 | 1.112500 |
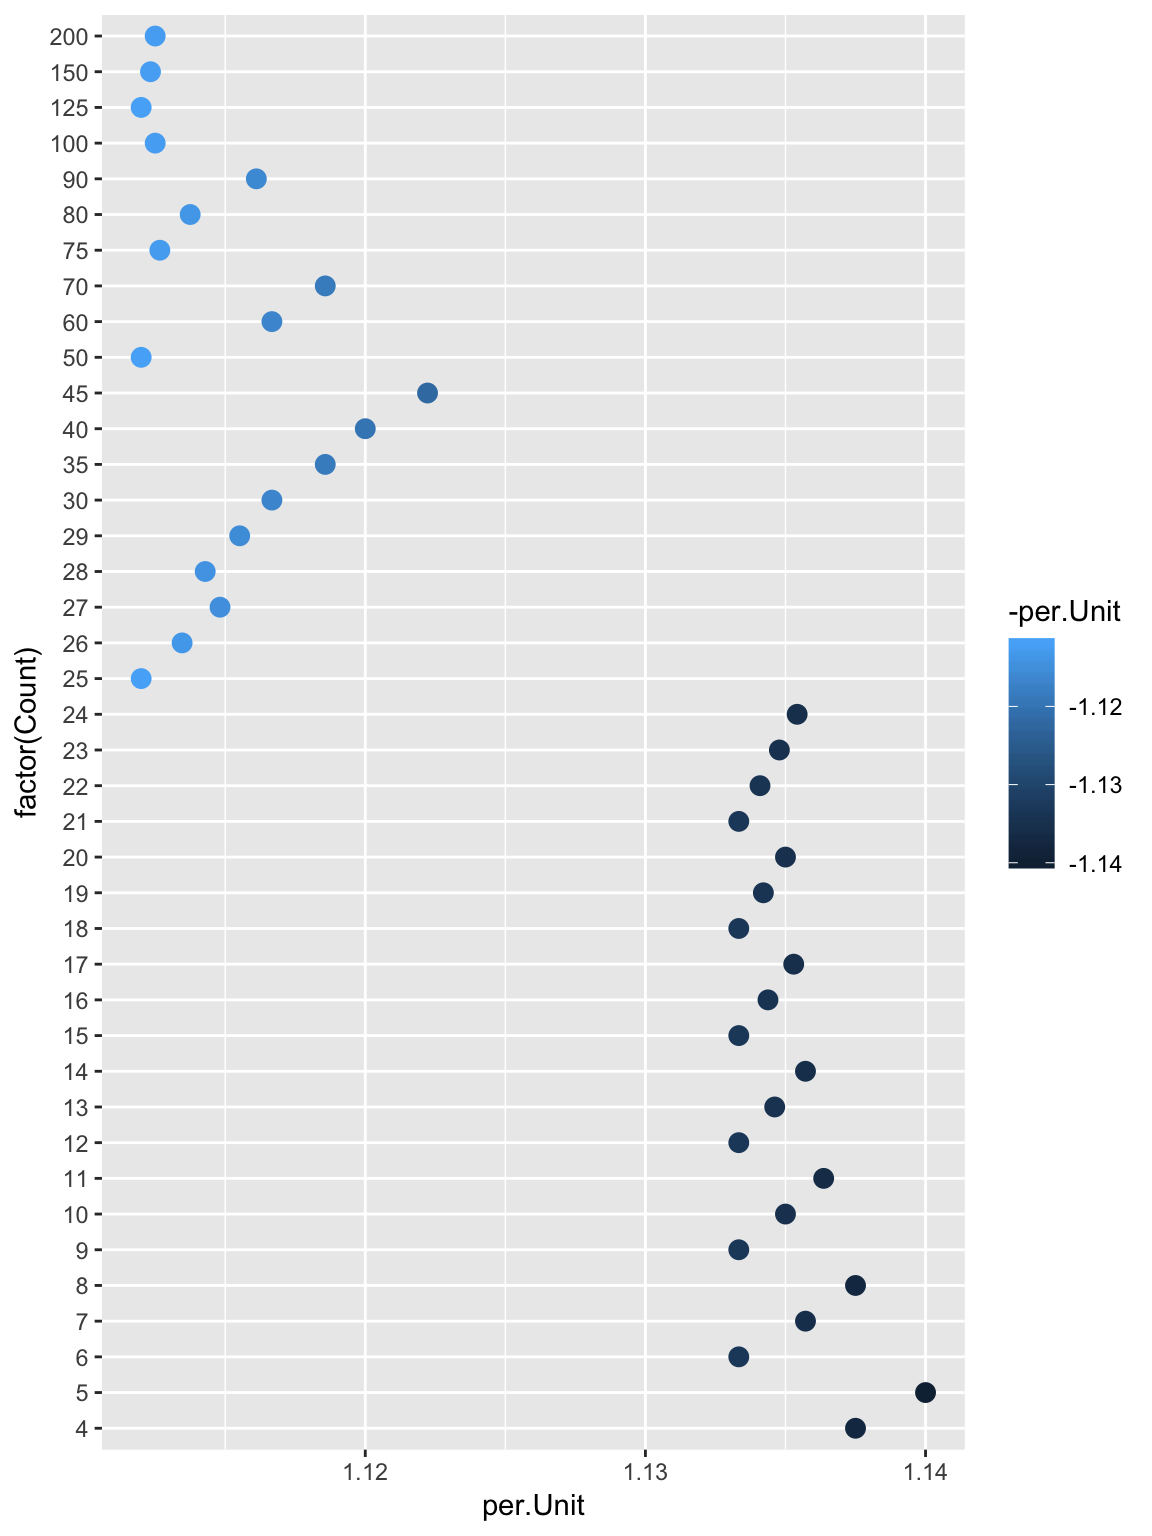
I added a per.Unit column because this was what first caught the attention of data-science Twitter: There’s no pattern to the per-unit cost. In fact, there are 27 different per-unit costs for the 40 menu items. Let’s see what the lowest per-unit costs are:
| Count | Price | per.Unit |
|---|---|---|
| 25 | 27.80 | 1.112000 |
| 50 | 55.60 | 1.112000 |
| 125 | 139.00 | 1.112000 |
| 150 | 166.85 | 1.112333 |
| 100 | 111.25 | 1.112500 |
| 200 | 222.50 | 1.112500 |
| 75 | 83.45 | 1.112667 |
| 26 | 28.95 | 1.113462 |
| 80 | 89.10 | 1.113750 |
| 28 | 31.20 | 1.114286 |
The lowest per-unit costs are for 25/50/125 wings. There are 11 menu choices with a per-unit cost below $1.115, and there are 17 menu choices with a per-unit cost below $1.120. The most expensive selections are the 21 menu items below 25 wings, which all have a per-unit cost between $1.13 and $1.14.
This nonsensical pattern prompted data-science Twitter to start creating plots and equations and trying to find the best combinations to save money.
Creating a simple order maximizer seemed like a good exercise for building my first Shiny app. As we’ve seen, we can get the best prices if we try to create orders using the 25- or 50-unit menu items as our base.
In the replies to the original Twitter post, @SharpeWordz showed, using the lpsolve package in R, that there are a few irregular combinations that could offer a $0.05 saving over the menu price. (The link leads to his Google doc of his results.)
It took a few tries to write code that was efficient and a few tries to get it to work within the Shiny app wrapper. In the end, the code will quote the menu price for any request that matches one of the menu choices. For irregular requests, it will create a base order of x number of orders of 25 wings plus 1 order that fulfills the remainder of the request. It will show a total cost and a per-unit cost of the entire order. In almost most irregular cases, the per-unit cost will be under $1.12. Danny’s Wok has its own mobile ordering apps and website ordering, so it doesn’t need my help. But it was a good exercise to learn some basic Shiny and it seems to work as an <iframe> call in this post.
Here’s the app. You can use the arrows to add or subtract to the request or type a number directly into the window.
Code and data at Github
Top image: Photo by Fancycrave.com via Pexels.com