The Australian Open has enacted a new extreme heat policy for this year’s tournament, which begins Jan. 14 in Melbourne. Over the past few years, it has seemed, tennis’s first Grand Slam event of the campaign has been notable for the pictures of flushed players looking stricken while wearing gigantic towels filled with ice.
.@geniebouchard getting all cozy with her ice towel..it didn’t help. pic.twitter.com/6TKyvlXq4V
— Jimmie48 Photography (@JJlovesTennis) August 30, 2016
It was anything but a boring day at the Australian Open as Gael Monfils nearly melted and Roger Federer cranked up the heat on the Grand Slams over prize money. My column, written while wearing an ice towel https://t.co/HkyG9ejsLg
— Christopher Clarey (@christophclarey) January 18, 2018
Tournament organizers have been faced with calls to do more to protect players from the effects of extreme heat in the middle of Australia’s summer. The tournament previously used wet-bulb globe temperature readings to trigger additional stoppages in play.
Wet-bulb globe temperature is sort of the weighted runs created of heat scales, combining three different temperature measurements to capture the additional effects of humidity, wind speed and radiation from the sun.
In advance of the 2019 tournament, Tennis Australia medical personnel worked with the University of Sydney’s Thermal Ergonomics Laboratory to create the heat stress scale, which takes into account the same environmental factors.
ICYMI: #AusOpen is introducing a more extensive Extreme Heat Policy (EHP) based around the AO Heat Stress Scale (AO HSS).
— #AusOpen (@AustralianOpen) December 30, 2018
Details 👉 https://t.co/hKm1DlI7k9 pic.twitter.com/f48mtQMtJI
“The AO Heat Stress Scale takes advantage of the latest medical research into the effects of heat on the human body including the maximum heat stress an athlete can safely withstand, the sweat rate of that person and their core temperature,” Dr. Carolyn Broderick, Tennis Australia’s chief medical officer said in a story posted to the tournament website.
“The scale also accounts for the physiological variances between adults, wheelchair and junior athletes while also taking into account the four climate factors – air temperature, radiant heat or the strength of the sun, humidity and wind speed – which affect a player’s ability to disperse heat from their body,” she said.
Until this year, the only provisions for extreme heat were to allow a 10-minute break between the second and third set for women’s matches and to halt play on all courts (except the two main stadiums with roofs) when the temperature reached a certain threshold or at the discretion of the tournament referee. Starting with 2019, a 10-minute break between sets can be added to men’s matches when the scale reaches its critical level.
In light of the pictures we had seen in recent years of melting players and of this new policy, I was interested in whether Melbourne’s weather had changed over the years. Was the heat getting worse?
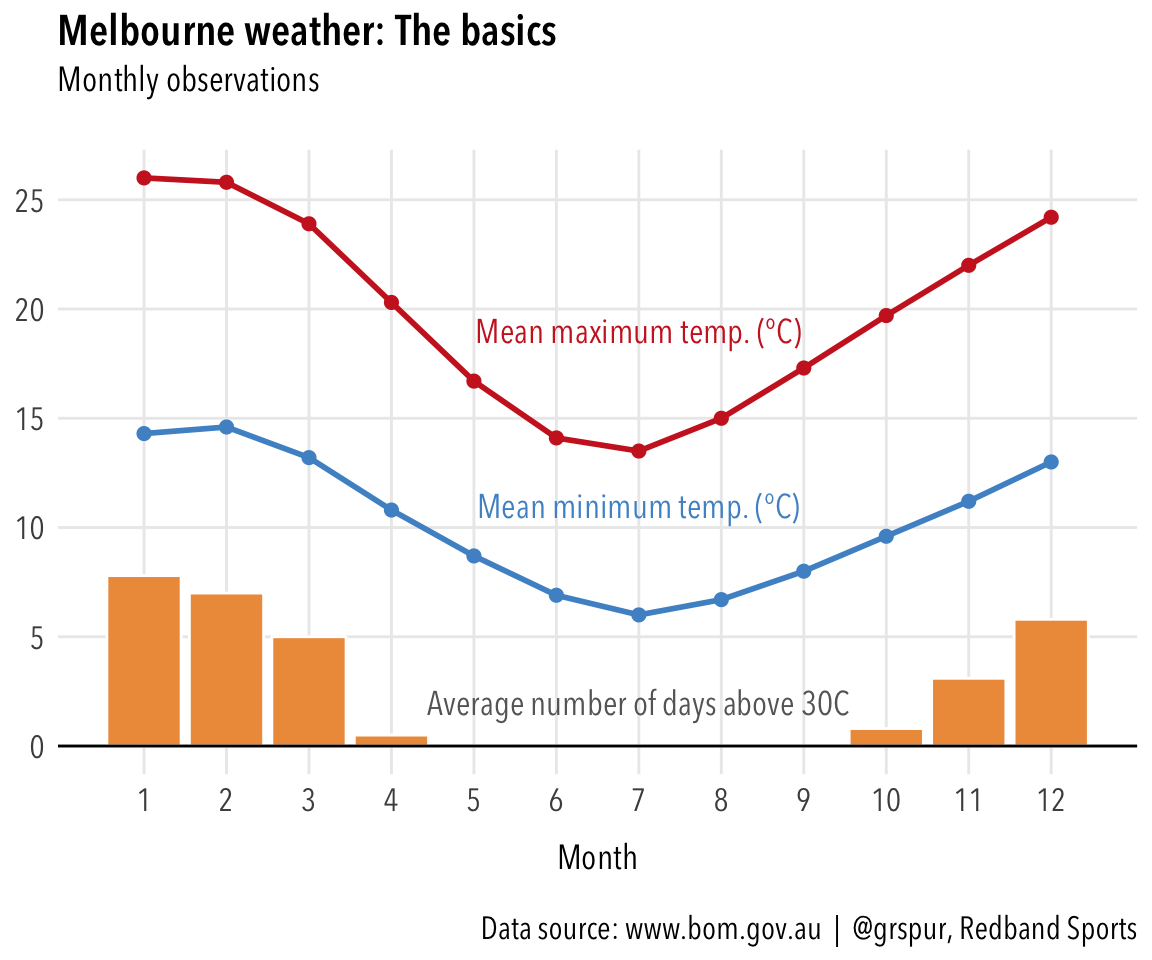
First, some basics. January is the month with the highest temperatures in Melbourne, with a mean daily temperature maximum of 26.0C, the lowest 3 p.m. relative humidity (47 per cent) and the highest average number of days with the temperature above 30C (7.8). These observations are from the Melbourne regional weather office, measured between 1855 and 2015 (between 1955 and 2015 for the midday temperature).
The tournament moved to January from December in 1987 and physically moved from the grass courts at Kooyong Tennis Club to the hard courts at Melbourne Park in 1988. Since 1989, the tournament has fallen in a fixed rotating pattern between Jan. 13 and Feb. 1.
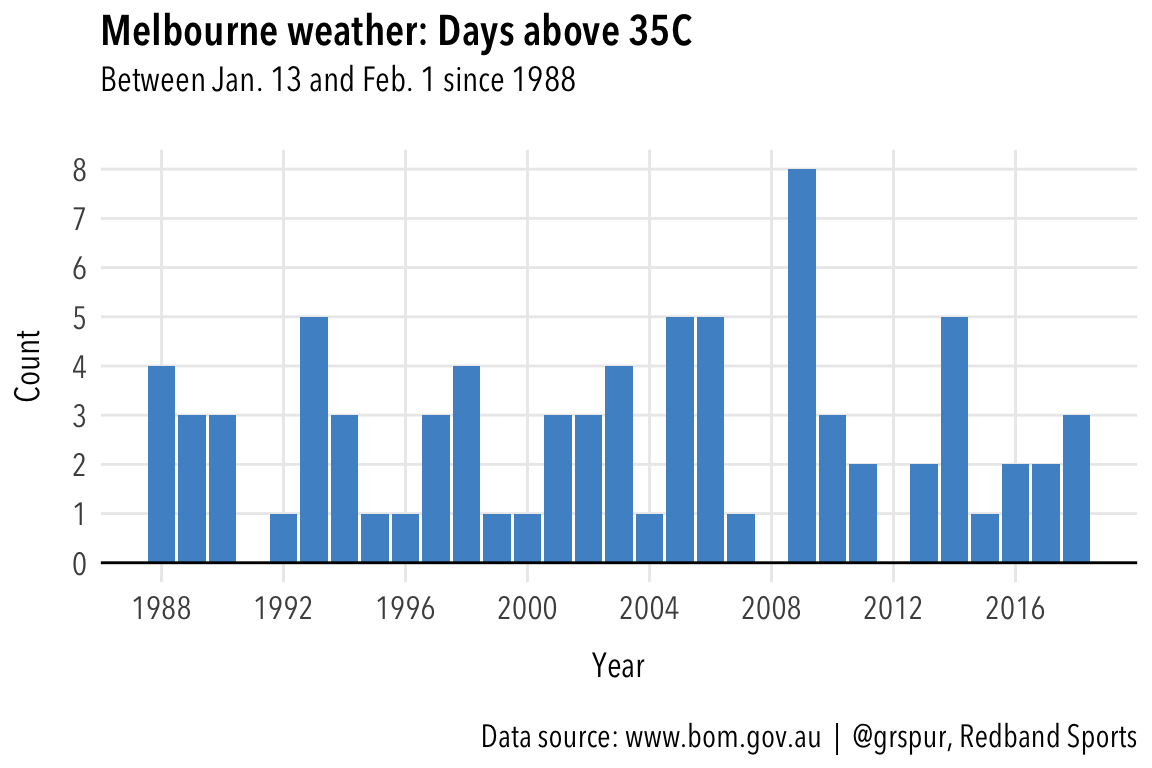
From the general data above, the Australian Bureau of Meteorology says the 90th percentile maximum temperature in January is 35.6C. So let’s see how many days in our tournament calendar range have reached 35C or above.
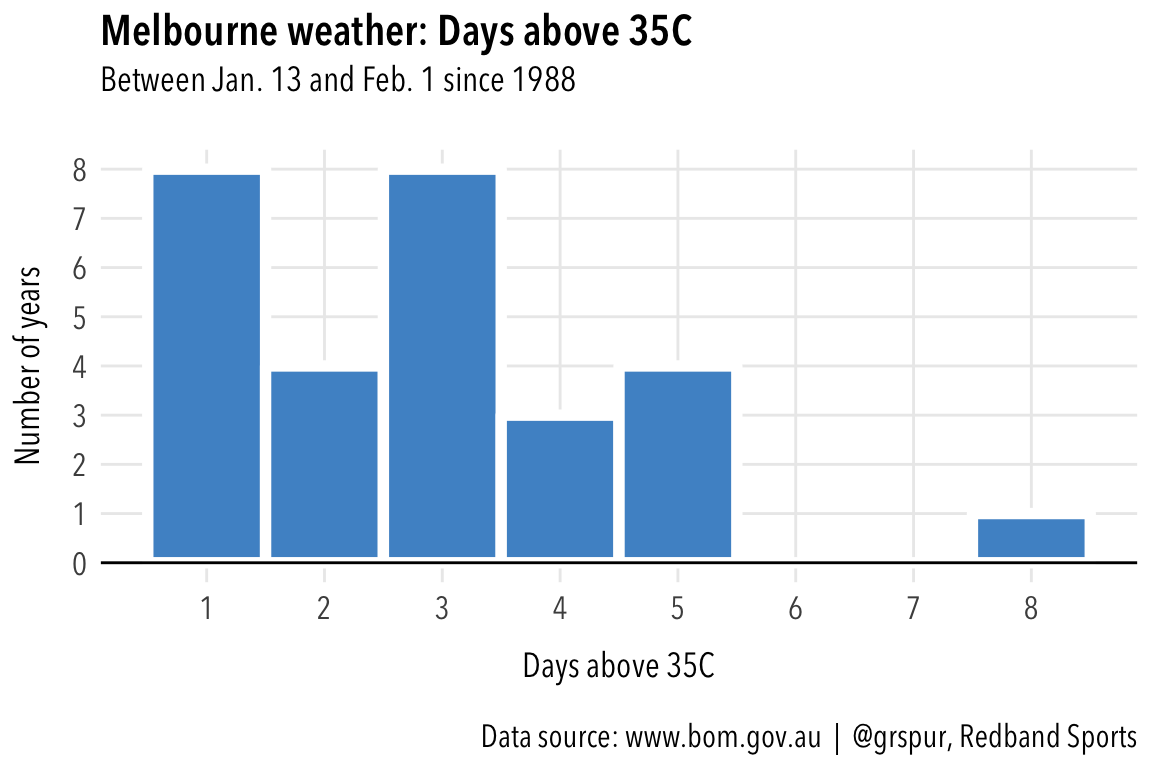
We can view this data another way with a histogram that shows us how often this period has accumulated days above 35C. (This doesn’t include the three years when there were zero days recorded above 35C.)
The 2009 event remains the hottest on record with eight days over 35C and an average maximum temperature of 34.7C (the average for those 14 days at the Melbourne weather office was 34.4C).
The generalized data above doesn’t tell us whether conditions are getting worse in Melbourne and whether the attention the heat has received is a recent phenomenon or a result of increased media exposure, with matches available on TV throughout the night on ESPN, TSN and other outlets. (“Sleep is for the weak,” the Australian Open’s Twitter feed likes to remind its fans in North and South America and western Europe.)
Below is a chart showing the range of January maximum temperatures in Melbourne since 1910.
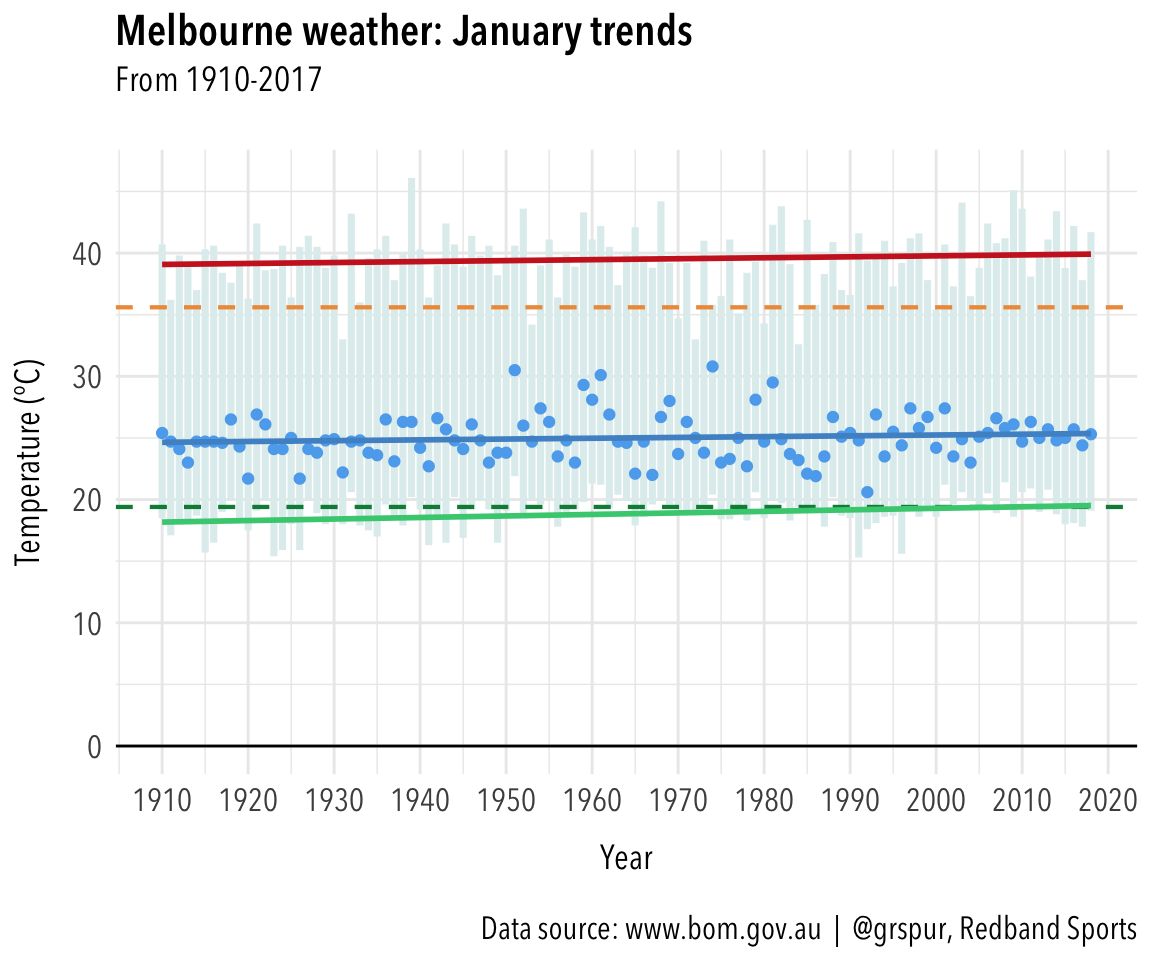
The orange dashed line is at 35.6C, the 90th percentile mark cited above for the mean maximum temperature in January, and the dark green dashed line is at 19.4C, the 10th percentile mark.
The blue dots are the median maximum temperature for January of that year and the blue line running through them is the linear regression trend line showing the median temperature has changed about 0.0066C per year, or about 0.66C in the last 100 years.
The solid red and green lines are the trend lines for the highest and lowest maximum temperatures. The slope for the red line shows an increase of 0.77C over the last 100 years. The slope for the green line shows an increase of 1.24C for the last 100 years.
It seems safe to say Melbourne is getting warmer but the tight clustering of the medians over the past decade shows the event hasn’t undergone the wild yearly swings that can be seen in the 1950s through the 1980s. There are hot days, and they are gradually getting hotter, but that’s what the extreme heat policy is for. There still seems to be lots of pleasant summer days.
Below is a heat map (pun coincidental) of the maximum temperature during the tournament from 1988 to 2018.
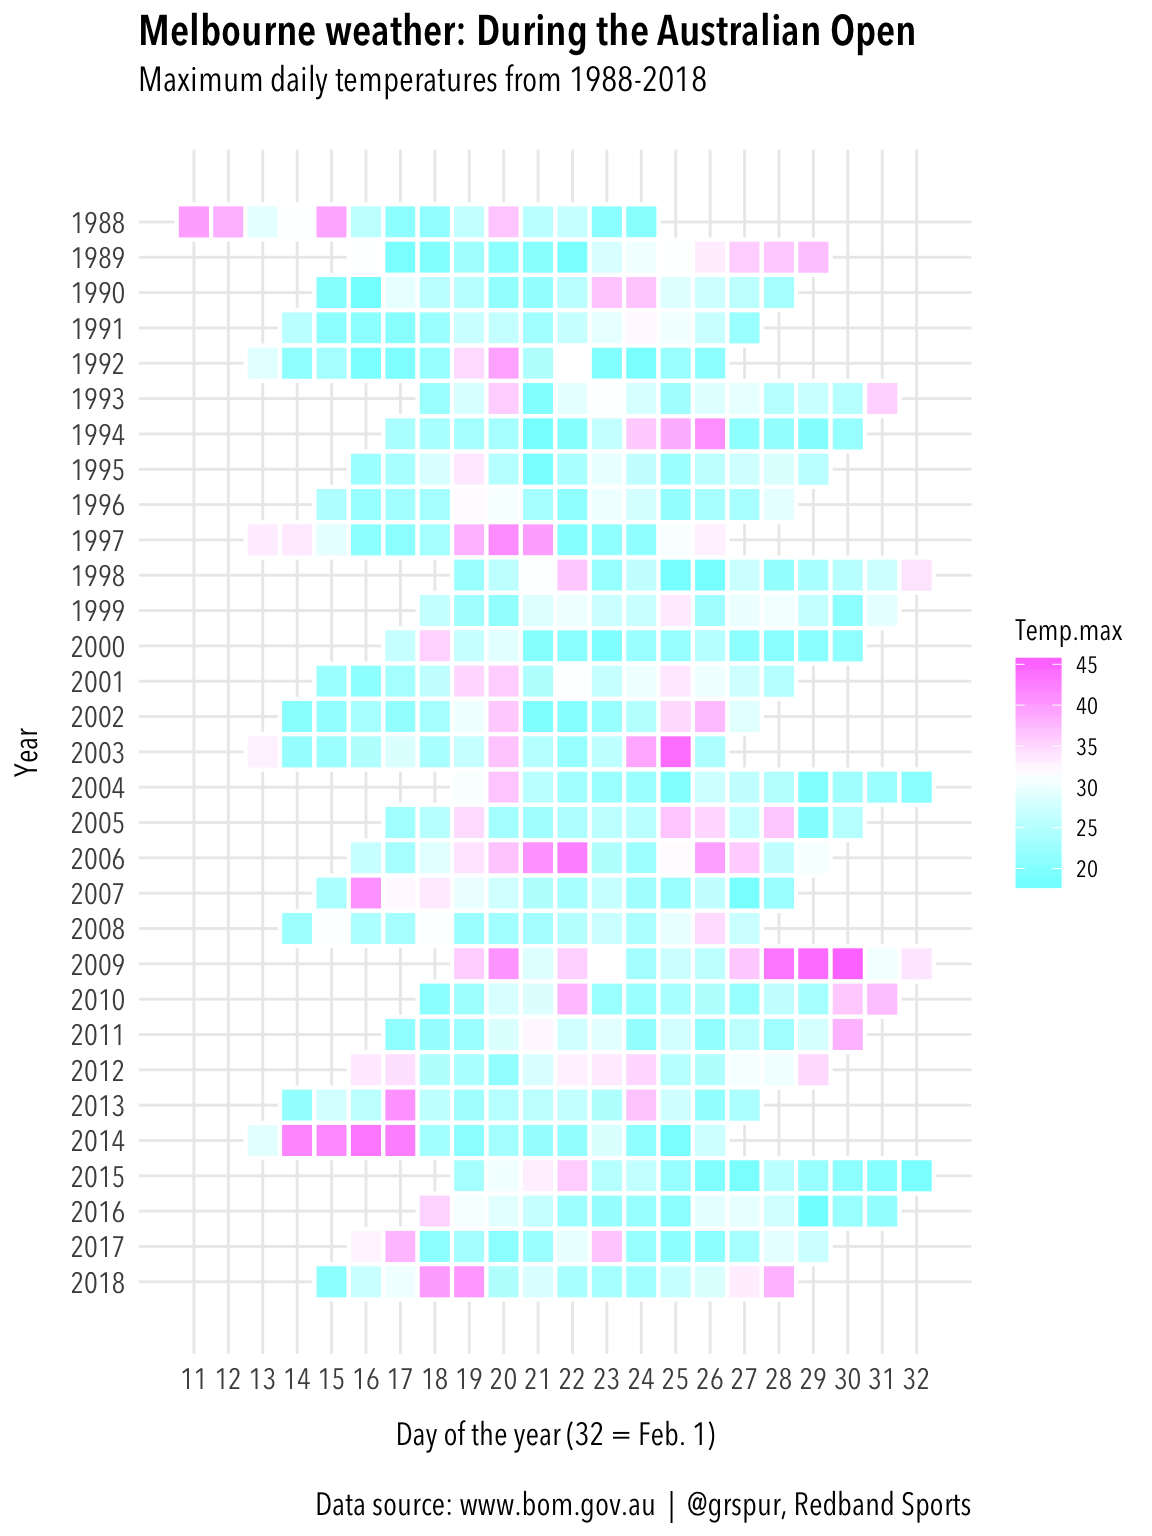
The 2009 and 2014 tournaments stand out, of course, for their multiple-day runs of extreme heat. The invocation of the heat policy reached a bit of a crisis point in 2014 when Melbourne suffered through four straight days of temperatures above 40C during the start of the event. Several players withdrew and many were stricken by the heat. Canadian player Frank Dancevic collapsed in the third set of his match with Benoit Paire, although he managed to finish.
“It looks terrible for the whole sport when people are collapsing, ball kids are collapsing, people in the stands are collapsing,” Andy Murray was quoted by The Associated Press.
As seems to be a common occurrence now, the long-range forecast shows a run of hot days at the start of this year’s event, followed by a very pleasant second week.

Photos: Melbourne cityscape by doctor-a, and adorable koala by skeeze, both via Pixabay.com.