
Back in March we investigated some 2018 season predictions from sports books and statistical projections published at FanGraphs.com.
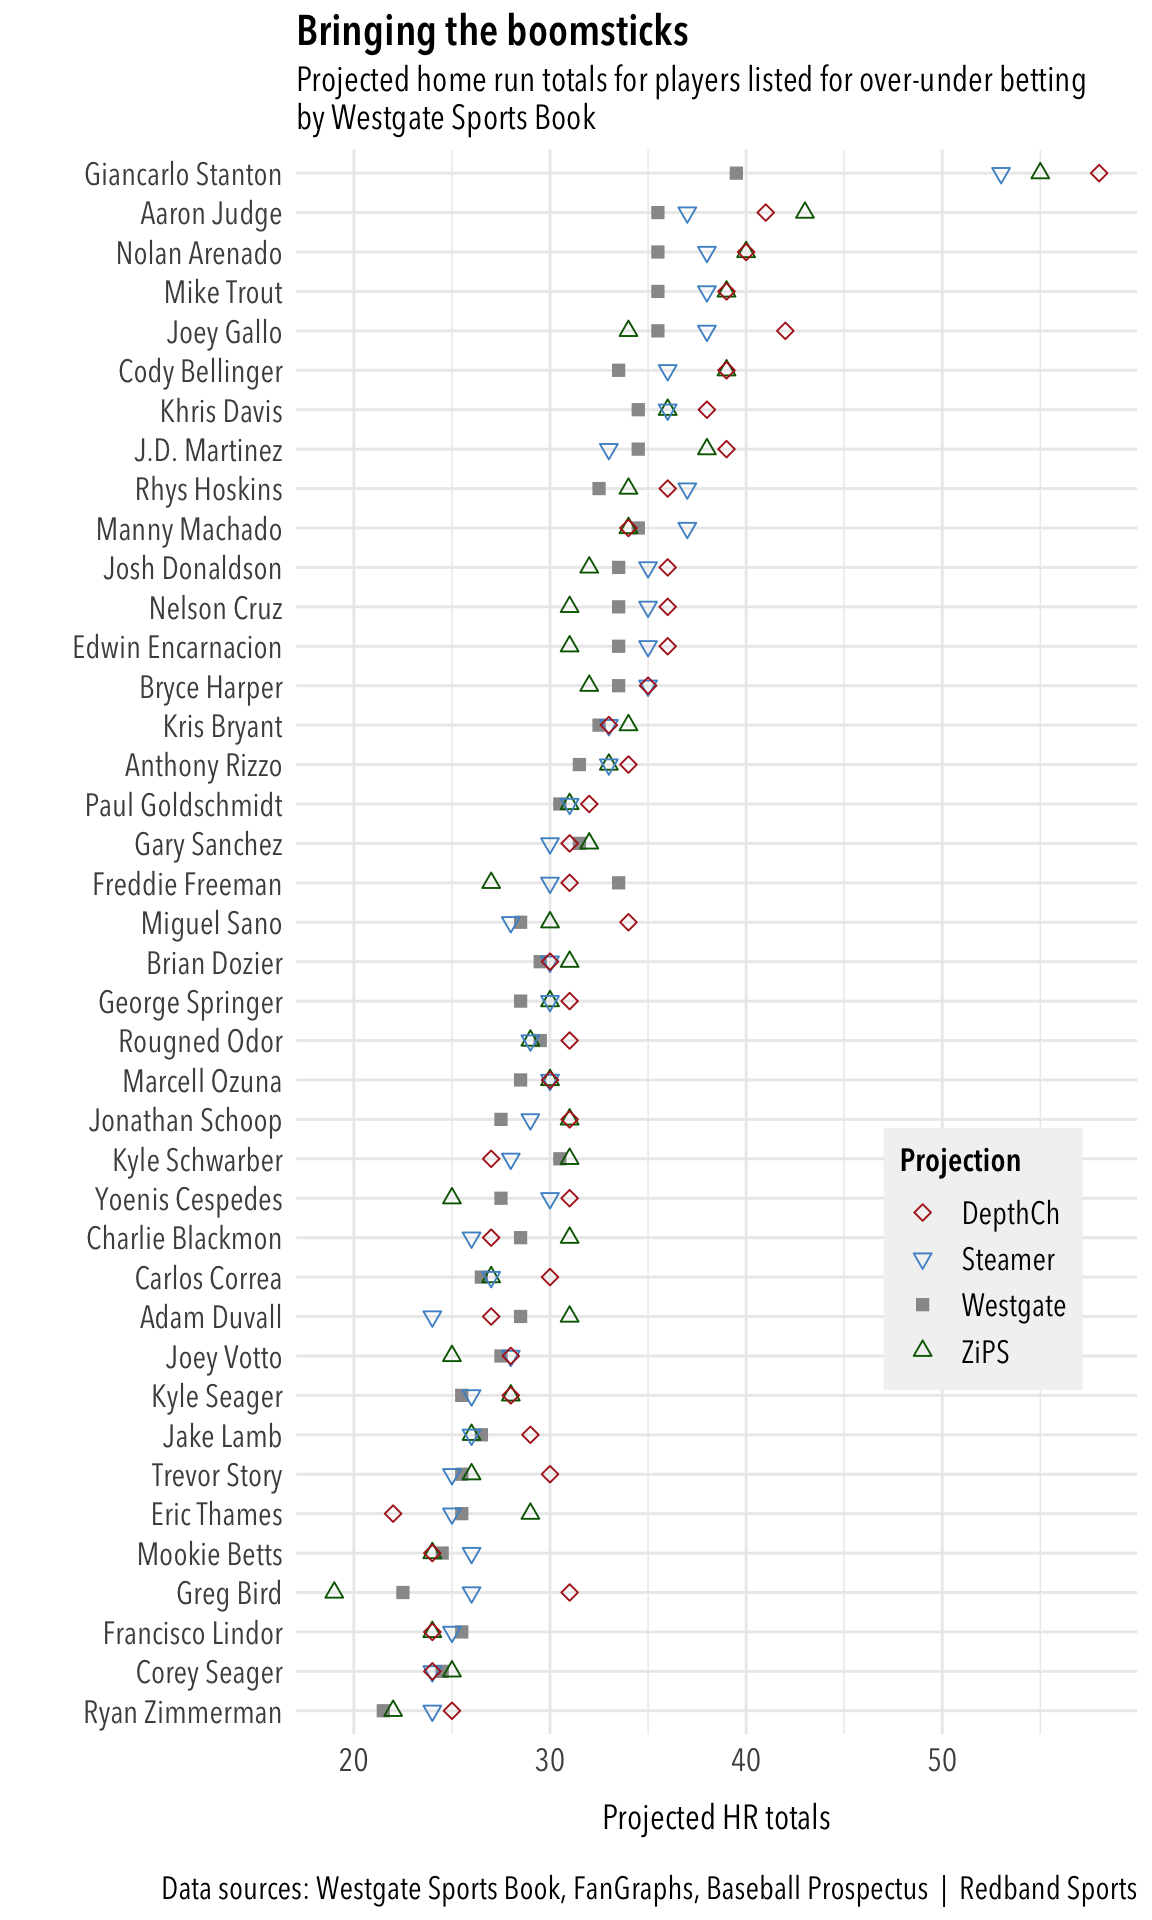
Here are the initial projections for home runs. The players shown are those offered for over-under betting by Westgate Sports Book in Las Vegas. Projections from ZiPS, Steamer and FanGraphs’ Depth Charts were added manually to the data.
Let’s look at how the players performed compared to the projections. The solid black dot indicates the final totals.
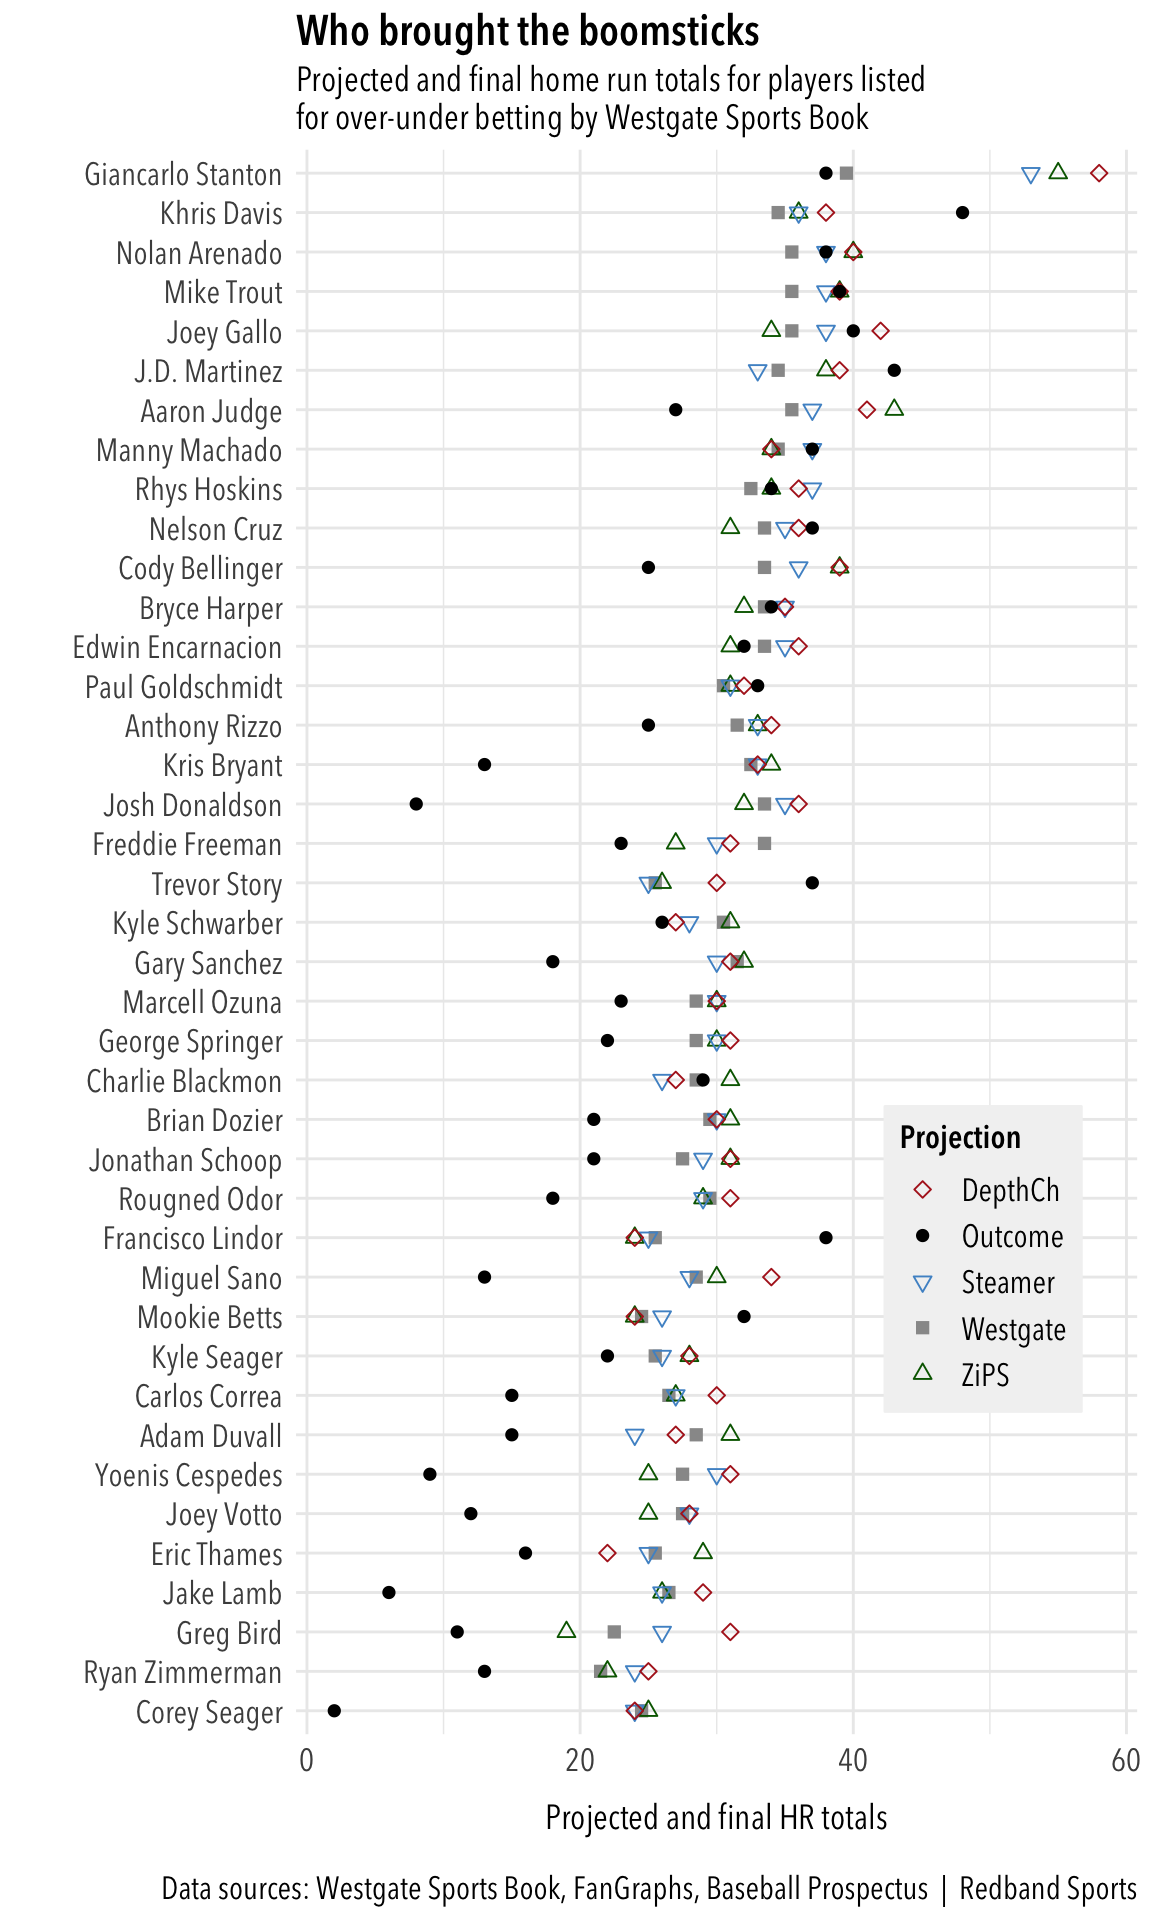
Right at the top, the Yankees’ Giancarlo Stanton didn’t come close to the hype projected at FanGraphs and finished just below the line set by Westgate (38 vs. 39.5). But Stanton wasn’t alone in falling short of expectations. Across-the-board under bets would have netting a lot of money. In fact, only seven of the 39 players listed exceeded all expectations (from the top): Khris Davis, J.D. Martinez, Nelson Cruz, Paul Goldschmidt, Trevor Story, Francisco Lindor and Mookie Betts. And only 14 players would have earned a winning over bet at Westgate.
| Player | Westgate | Outcome |
|---|---|---|
| Khris Davis | 34.5 | 48 |
| Francisco Lindor | 25.5 | 38 |
| Trevor Story | 25.5 | 37 |
| J.D. Martinez | 34.5 | 43 |
| Mookie Betts | 24.5 | 32 |
| Joey Gallo | 35.5 | 40 |
| Mike Trout | 35.5 | 39 |
| Nelson Cruz | 33.5 | 37 |
| Manny Machado | 34.5 | 37 |
| Nolan Arenado | 35.5 | 38 |
| Paul Goldschmidt | 30.5 | 33 |
| Rhys Hoskins | 32.5 | 34 |
| Bryce Harper | 33.5 | 34 |
| Charlie Blackmon | 28.5 | 29 |
Below is the list of the 12 players who missed their over-under line by the largest margin.
| Player | Westgate | Outcome |
|---|---|---|
| Josh Donaldson | 33.5 | 8 |
| Corey Seager | 24.5 | 2 |
| Jake Lamb | 26.5 | 6 |
| Kris Bryant | 32.5 | 13 |
| Yoenis Cespedes | 27.5 | 9 |
| Joey Votto | 27.5 | 12 |
| Miguel Sano | 28.5 | 13 |
| Adam Duvall | 28.5 | 15 |
| Gary Sanchez | 31.5 | 18 |
| Carlos Correa | 26.5 | 15 |
| Greg Bird | 22.5 | 11 |
| Rougned Odor | 29.5 | 18 |
It’s mostly a list of players who missed great portions of the season with injuries — except for Votto, who managed only 12 homers in 145 games this season. He had never failed to hit at least 24 homers in any season in which he played at least 130 games. Roughned Odor’s horrible start to the season, along with some injury time, also landed him on this list.
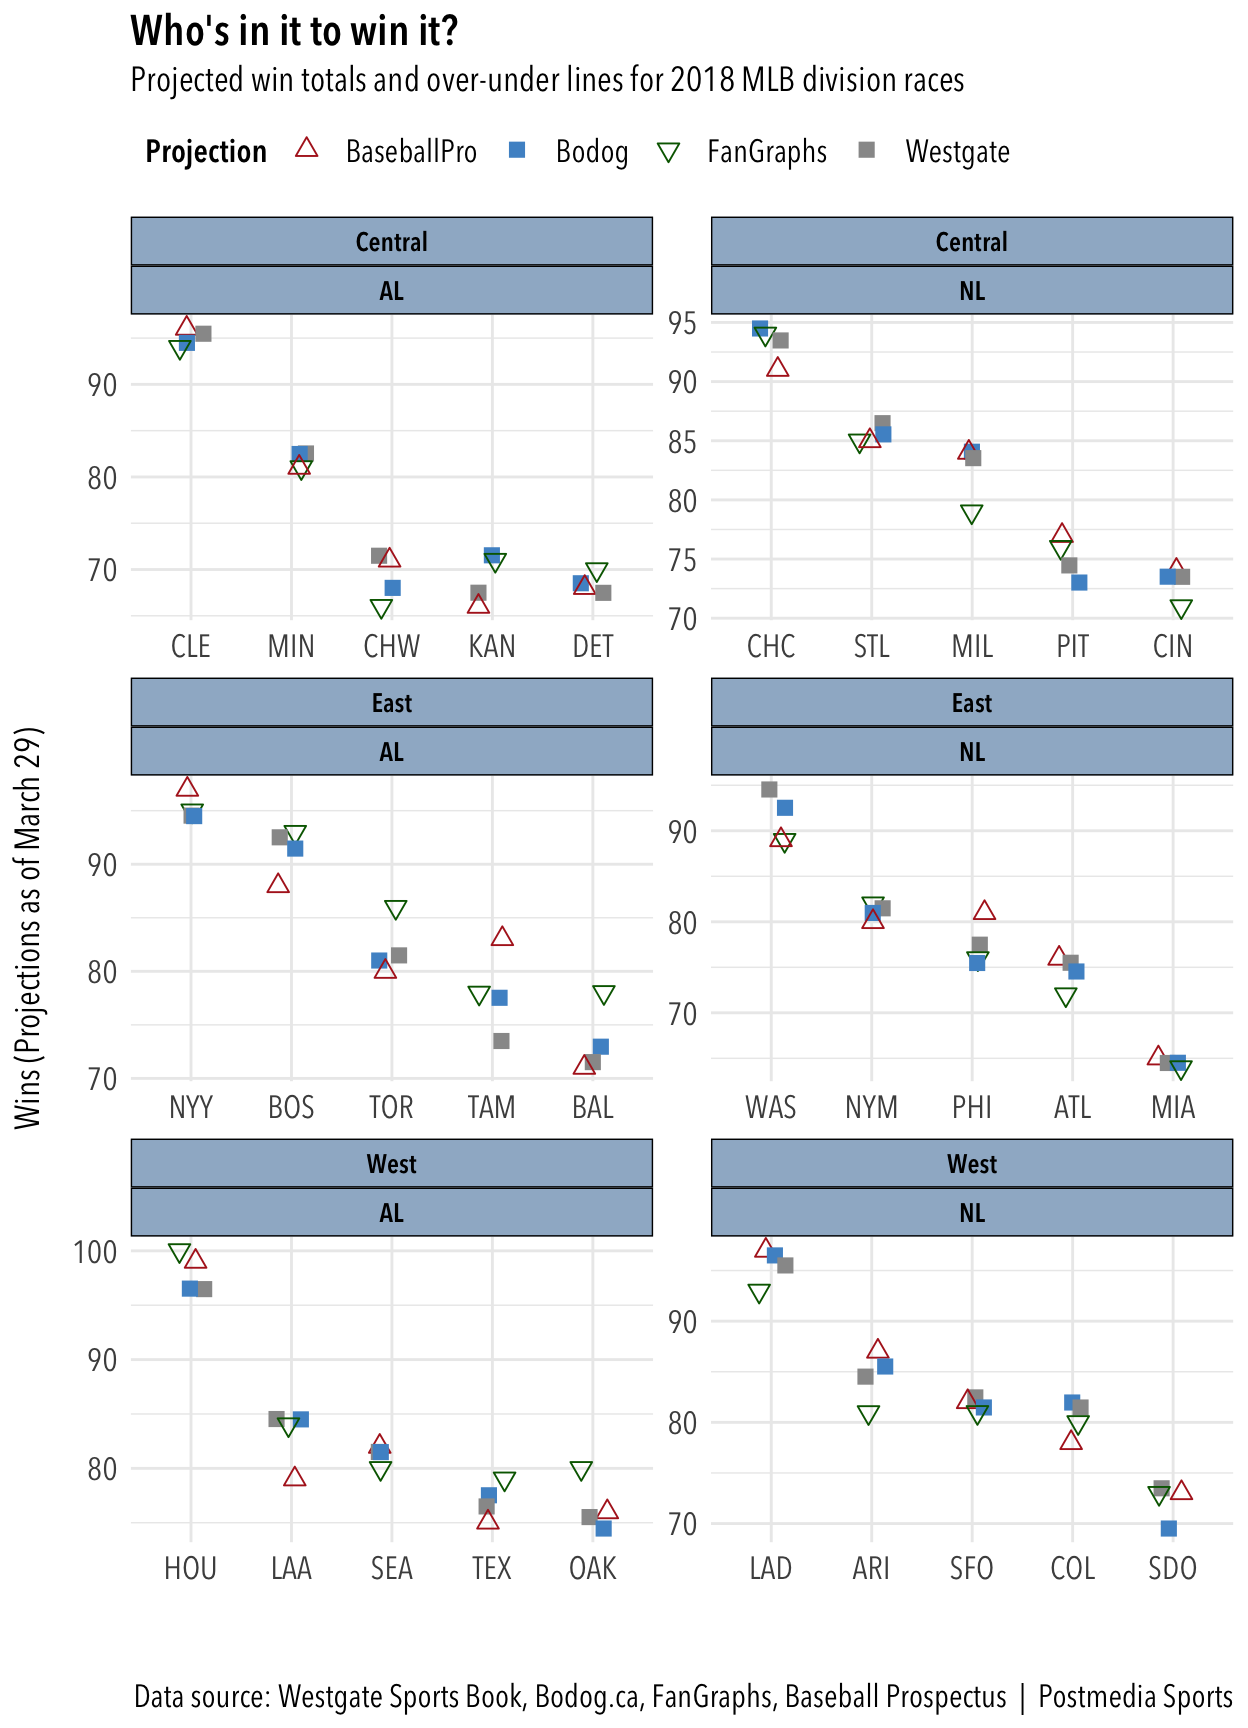
We also plotted the range of predictions for teams’ win totals based on the over-under lines from Westgate and Bodog.ca and projections from FanGraphs and Baseball Prospectus. This was the original plot:
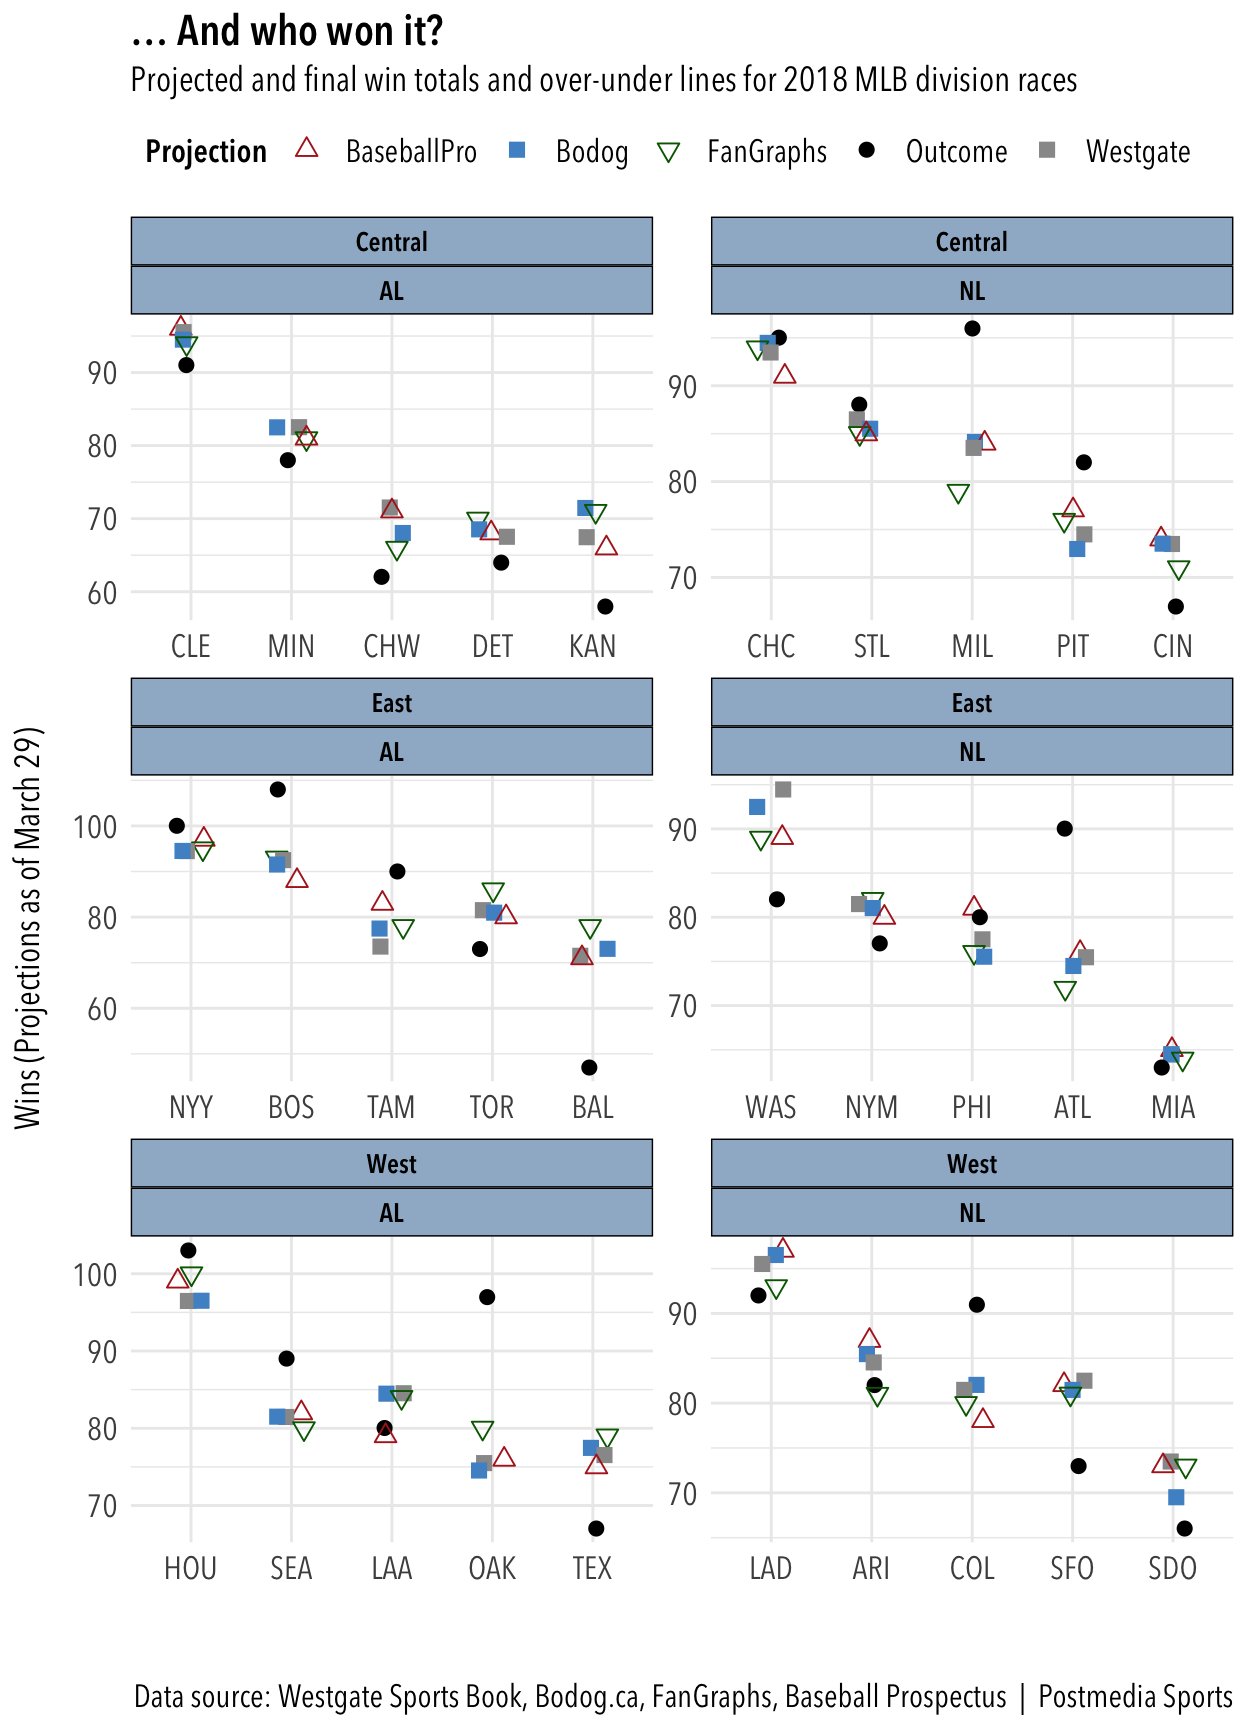
Of the two divisions I watch the most, they all overpredicted the entire AL Central and underprojectd the Red Sox and Yankees in the AL East. Baseball Prospectus came closest to projecting Tampa Bay’s strong season. They all missed badly on Oakland, Milwaukee and Atlanta. They mostly got the orders of finish correct, apart from the teams mentioned above.
It would be interesting to calculate, if we can, which set of projections was closest to being correct most often. First let’s see how many times each projection was over, under or equal. (Note: Westgate and Bodog won’t have any equals because they set their lines at half-run intervals to avoid pushes.)
We can also calculate the average difference between the projected win total and the actual win total for all 30 teams among the four groups. We’ll use the absolute values, treating negatives and positives the same, otherwise they’ll cancel each other out in the final calculation.
| Proj | Over | Equal | Under |
|---|---|---|---|
| Westgate | 13 | 0 | 17 |
| Bodog | 13 | 0 | 17 |
| FanGraphs | 14 | 0 | 16 |
| Baseball Pro | 13 | 0 | 17 |
## [1] "Westgate average = 8.3 wins"## [1] "Bodog average = 8.247 wins"## [1] "FanGraphs average = 8.133 wins"## [1] "Baseball Prospectus average = 7.6 wins"Baseball Prospectus came out with the lowest average difference at 7.6 wins. The others were close to the same at just over 8.0.
Let’s check out the distribution of the differences for each group and figure out the median of the distribution, the mode (most common value), and the median absolute deviation. We’ll show those on a histogram of each distribution.
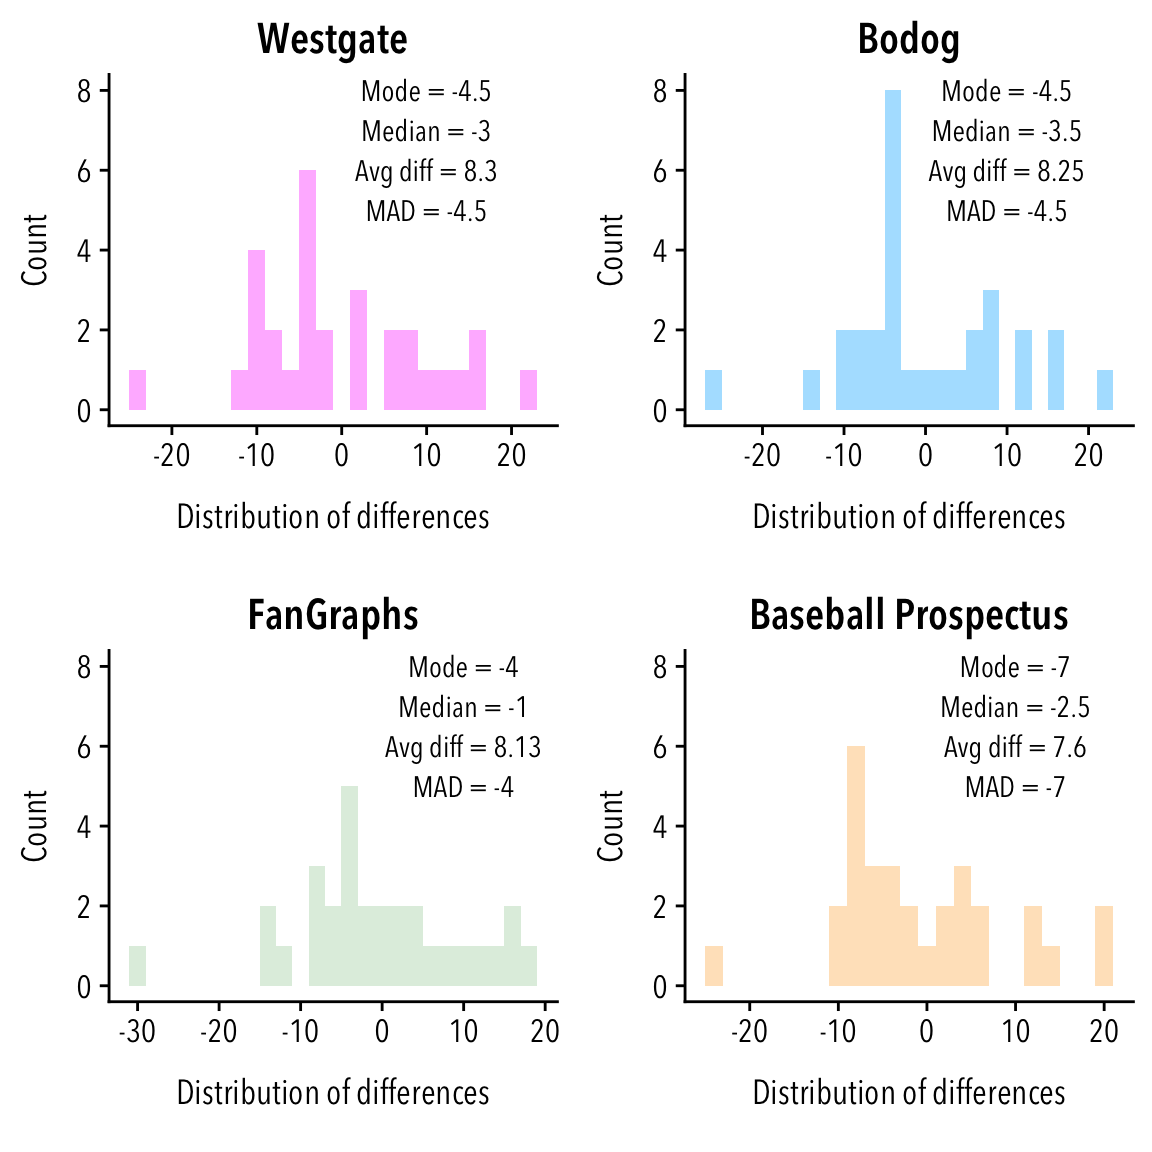
Baseball Prospectus’ edge in the average difference is undercut by the high mode of -7. FanGraphs’ median was the closest to 0 and also had the lowest mode and the lowest median absoluate deviation.
None of these systems seems to stand out from the rest, plotting them together derives fairly tight clusters for each team. It would be interesting to study other years to see if the betting the full slate of unders nets a profit each time or if there are particular teams that under- or over-perform against their projections (looking at you Oakland and Tampa Bay).
Also see: A consideration of the 2018 Cy Young races
R Markdown and data files for this project are here.
Photo: Pixabay via Pexels.com